Soccer Match Analysis Chart – Performance Analysis and Future Forecast
RJ0600052_15
- Last Update 07/04/2025
- File Size 0.5MB
- # of Slides 2
- File Format PPTX
- Slide Ratio 16:9
- Color
Keywords
- #Content-Based Slides
- #Design-Based Slides
- #Business Vision and Strategy
- #Market and Competitor Analysis
- #Graph
- #Core Competencies
- #Market Share
- #Market Analysis
- #Horizontal Bar
- #Circles
- #Segmented Horizontal Bar
- #Doughnut Chart
- #16:9
- #donut chart PowerPoint slide
- #pie chart presentation template
- #soccer match analysis chart
- #performance evaluation slides
- #stacked bar graph PPT
About the Product
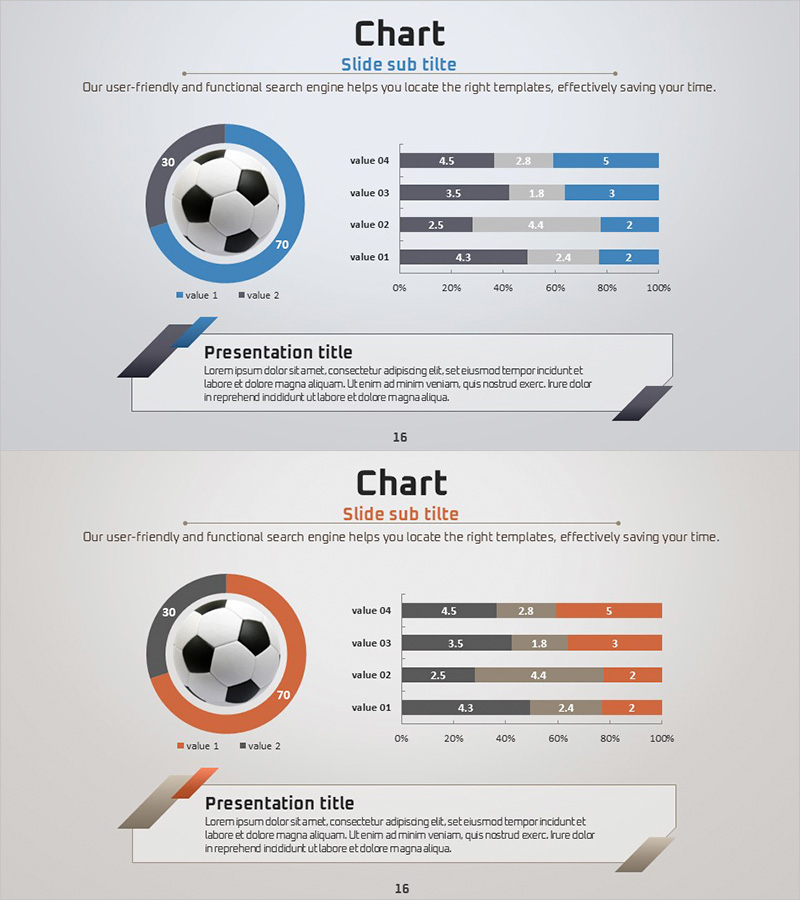
A 2-slide PowerPoint presentation featuring donut chart design for soccer match analysis and performance evaluation. This slide deck combines a central soccer ball image with an outer donut-shaped pie chart, visualizing key metrics such as possession rate, shot accuracy, and pass completion percentage. Available in two color schemes—blue and orange—with stacked horizontal bar graphs for multi-layer data comparison. Ideal for sports analytics, marketing performance reports, and market share presentations that require immediate deployment.
Usage Points
-
Main Usage
Multi-layer data visualization for sports performance analysis, market share comparison, and evaluation reporting. The central donut chart displays overall proportions while the right-side stacked bar graph presents detailed item-by-item numerical comparisons simultaneously. Suitable for executive briefings, marketing performance presentations, and investor pitch decks.
-
How to Use
Slide 1 features blue color scheme; Slide 2 uses orange scheme for flexible selection based on presentation theme or brand colors. Edit donut chart values and labels to input actual data, then modify bar graph item names and figures to create customized analysis materials.
-
Recommended For
Sports analysts, marketing managers, executives, data analysis teams, and consultants. Recommended for soccer/baseball/basketball game analysis, sales performance comparison, market share analysis, customer satisfaction evaluation, and product performance benchmarking presentations.
-
Slide Structure
Both slides share identical layout: left-center donut pie chart with soccer ball image (2 data series, 30/70 ratio display), right-side stacked horizontal bar graph with 4 items and 3 data series (0–100% range). Includes title and subtitle area at top, text box area at bottom.
Related Products
-

Sea Lighthouse Market Share Donut Chart
#Market and Competitor Analysis #Graph #Market Share
-

Market Share Analysis with Donut Graph – The Charm of Bear
#Market and Competitor Analysis #Graph #Market Share
-

Red Market Share Slide – Compelling Donut Chart Design
#Market and Competitor Analysis #Graph #Market Share
-

Travel Destination Infographic Market Share – Intuitive Data Visualization
#Market and Competitor Analysis #Graph #Market Share
