Fashion Market Sales Status Graph – Data Visualization and Trend Analysis
RJ0300027_7
- Last Update 04/25/2025
- File Size 0.9MB
- # of Slides 2
- File Format PPTX
- Slide Ratio 16:9
- Color
Keywords
- #Content-Based Slides
- #Design-Based Slides
- #Market and Competitor Analysis
- #Financial Plans and Performance
- #Graph
- #Market Status
- #Sales and Revenue
- #Line
- #Line Chart
- #16:9
- #line chart PowerPoint
- #trend analysis slide template
- #data visualization chart
- #sales performance graph
- #time-series data presentation
About the Product
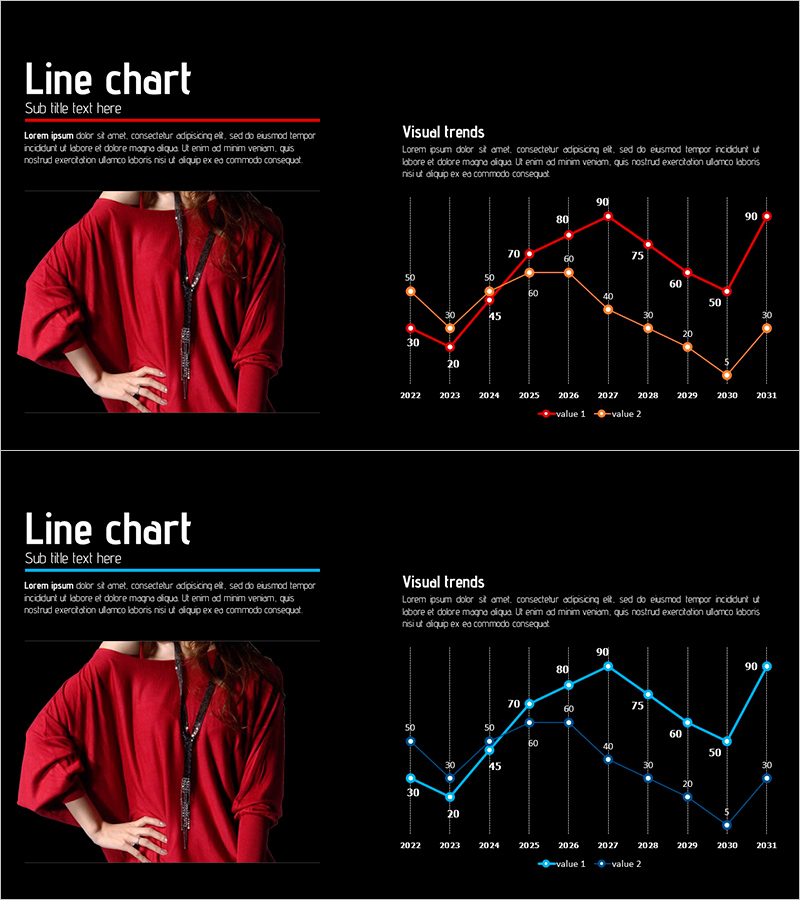
A PowerPoint slide featuring a dual-series line chart that visualizes fashion market sales trends and performance data from 2022 to 2031. The chart uses red and orange color coding to distinguish between two data series, with precise numerical values displayed at each data point for accurate information delivery. Formatted in 16:9 widescreen ratio across 2 slides, this template is ready for immediate use in presentations, financial reports, and market analysis documents. All colors and values are fully editable to match your specific data and branding requirements.
Usage Points
-
Main Usage
Clearly visualizes changes in sales, growth rates, market share, and other metrics over time. The dual-series comparison enables simultaneous representation of competitive performance, departmental results, product-line sales trends, and other complex datasets. Serves as an objective, data-driven analysis tool for stakeholder presentations.
-
How to Use
Insert this slide in the market analysis, financial overview, or business performance sections of your presentation. Replace the sample data points with your actual statistics, update axis labels and legend text to match your document context, and the slide is ready for immediate deployment.
-
Recommended For
Ideal for financial team revenue analysis reports, marketing team market research presentations, executive quarterly performance briefings, investor pitch decks, and business plan market overview sections. Particularly valuable in fashion, retail, distribution, and financial services industries where data-driven decision-making is critical.
-
Slide Structure
Each slide contains a title area, descriptive text box, and a dual-series line chart. The chart features an X-axis spanning 2022–2031, a Y-axis scaled 0–90, and two data series (value 1 and value 2) with numerical values marked at each node. An image placeholder on the left maintains visual balance and supports contextual storytelling.
Related Products
-

Highlighted Curved Graph for Market Analysis
#Market and Competitor Analysis #Financial Plans and Performance #Graph
-

Purple Green Flower Market Analysis – Market Status and Competitive Analysis
#Market and Competitor Analysis #Financial Plans and Performance #Graph
-

Sea Lighthouse Goal Market Strategy Line Graph – Revenue and Profit Growth
#Market and Competitor Analysis #Financial Plans and Performance #Graph
-

Visualizing Sales and Meeting Progress Over Time
#Market and Competitor Analysis #Financial Plans and Performance #Graph
