Newspaper Wide PowerPoint Template Line Chart - Market Analysis and Revenue Performance
RJ0200046_11
- Last Update 04/11/2025
- File Size 0.3MB
- # of Slides 2
- File Format PPTX
- Slide Ratio 16:9
- Color
Keywords
- #Content-Based Slides
- #Design-Based Slides
- #Market and Competitor Analysis
- #Financial Plans and Performance
- #Graph
- #Market Status
- #Sales and Revenue
- #Circles
- #Line
- #Doughnut Chart
- #Line Chart
- #16:9
- #line chart PowerPoint slide
- #multi-series trend analysis template
- #business data visualization PPT
- #market analysis presentation
- #revenue performance chart
- #how to create line graph in PowerPoint
About the Product
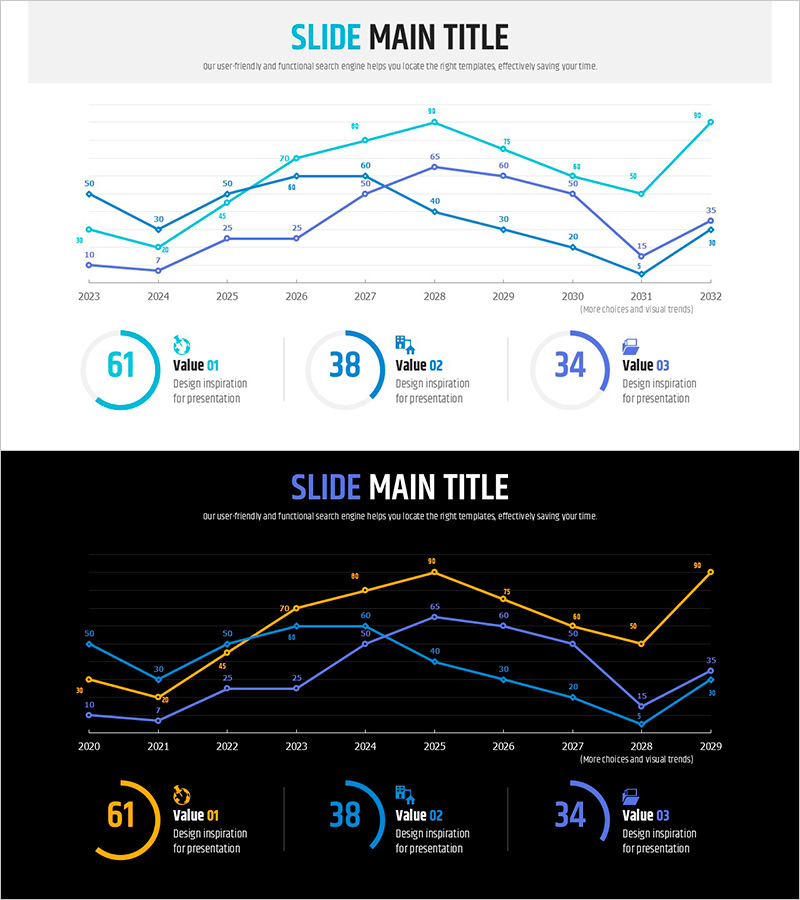
A professional line chart PowerPoint slide displaying three data series spanning from 2023 to 2032, ideal for presenting multi-year business trends and performance metrics. This slide deck includes two design variations: a light background version for print and standard presentations, and a dark background version optimized for large-screen displays. Each slide features a title area, a multi-series line graph with 10 data points per series, and three circular value indicators at the bottom to highlight key metrics. Perfect for market analysis, revenue performance, customer satisfaction tracking, and strategic planning presentations. Delivered in 16:9 widescreen PPTX format, fully editable in all PowerPoint versions.
Usage Points
-
Main Usage
Effectively communicate multi-year trends, quarterly performance changes, and comparative metrics across different business dimensions. This slide is designed for executive reports, investor presentations, marketing performance reviews, and strategic planning sessions where time-series data comparison is critical.
-
How to Use
Click on each data point in the line chart to input your specific values; the graph updates automatically. Edit the circular value indicators at the bottom to emphasize key performance metrics. Use the light background for printed materials and standard conference presentations, and the dark background for large-screen or digital display environments.
-
Recommended For
Finance managers, marketing directors, business analysts, consultants, and executives who present quantitative performance data. Ideal for quarterly earnings reports, annual business planning, investor relations materials, market research presentations, and competitive analysis briefings.
-
Slide Structure
Both slides follow identical layout: title section at top, three-series line graph in center with 10 data points per series (2023-2032 timeline), and three circular value indicators (Value 01, 02, 03) at bottom. Light version uses cyan, sky blue, and navy color palette; dark version features orange, cyan, and purple for strong visual contrast and readability.
Related Products
-

Highlighted Curved Graph for Market Analysis
#Market and Competitor Analysis #Financial Plans and Performance #Graph
-

Potted Doughnut Chart for Market Analysis – Performance vs Sales
#Market and Competitor Analysis #Financial Plans and Performance #Graph
-

Purple Green Flower Market Analysis – Market Status and Competitive Analysis
#Market and Competitor Analysis #Financial Plans and Performance #Graph
-

Building Analysis Chart – Visualizing Market Status and Performance
#Market and Competitor Analysis #Financial Plans and Performance #Graph
