Purple Green Flower Market Analysis – Market Status and Competitive Analysis
RJ0600108_24
- Last Update 07/20/2025
- File Size 0.8MB
- # of Slides 2
- File Format PPTX
- Slide Ratio 16:9
- Color
Keywords
- #Content-Based Slides
- #Design-Based Slides
- #Market and Competitor Analysis
- #Financial Plans and Performance
- #Graph
- #Market Status
- #Sales and Revenue
- #Column
- #Line
- #Column Chart
- #Line Chart
- #16:9
- #line chart PowerPoint slide
- #market analysis presentation template
- #dual-series chart
- #trend analysis slide
- #competitive analysis PowerPoint
- #market status visualization
About the Product
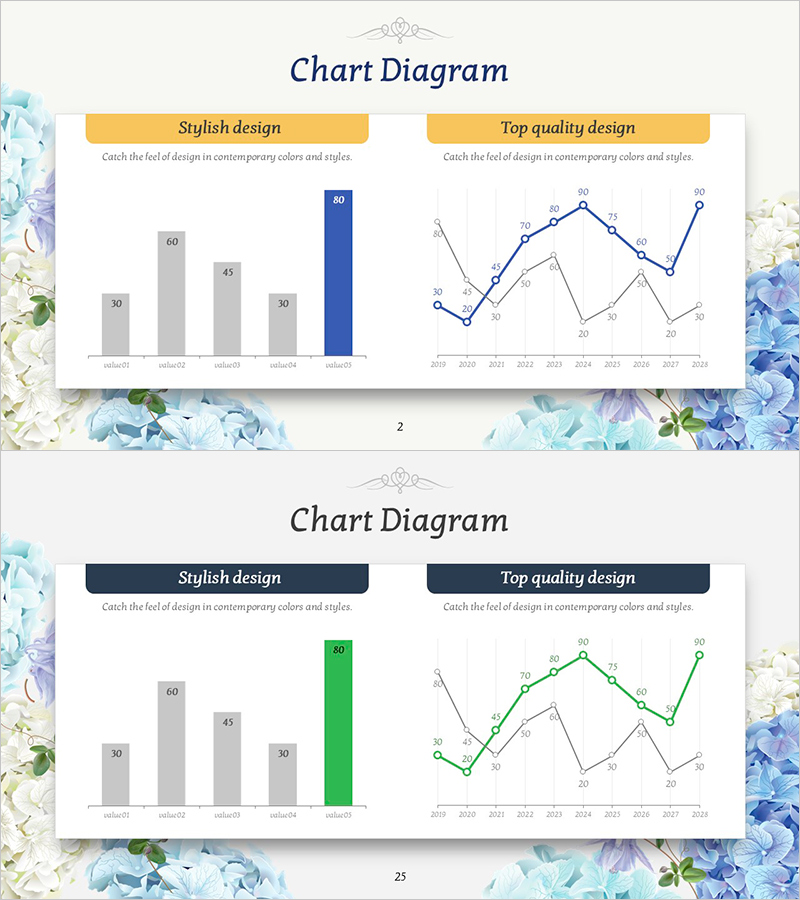
A PowerPoint slide featuring dual-series line charts designed for market analysis and competitive landscape visualization. The slide combines a vertical bar chart on the left with a multi-line trend chart on the right, enabling simultaneous display of quantitative metrics and time-series changes. The color palette of purple, green, and gray creates a professional presentation aesthetic. Formatted in 16:9 widescreen with 2 fully editable slides, this template is ready for immediate customization and deployment in business presentations.
Usage Points
-
Main Usage
This slide is designed to present time-based trend changes and competitive comparisons simultaneously in market analysis reports. The combination of bar and line graphs allows you to display quantitative data and trend lines together, providing clear evidence for strategic decision-making.
-
How to Use
Input numerical values in the left bar chart for each category and populate the right line chart with time-series trend data. Use this slide in the market analysis section of marketing plans, business reports, and investment proposals to explain competitive positioning and growth trajectories.
-
Recommended For
Ideal for marketing professionals, business analysts, and strategists presenting market dynamics. Effective in quarterly performance reviews, competitive benchmarking reports, business analysis documents, and investor pitch decks where data-driven insights are essential.
-
Slide Structure
Slide 1: Title area + left side 5-item vertical bar chart (gray and blue highlight) + right side 2-series line chart (2019–2028 trend data). Slide 2: identical layout with dark navy-green header. Both slides feature independently editable chart objects for flexible customization.
Related Products
-

Visualizing Sales and Meeting Progress Over Time
#Market and Competitor Analysis #Financial Plans and Performance #Graph
-

Consumer Insights & Behavioral Patterns Analysis Slide
#Market and Competitor Analysis #Graph #Market Status
-

Column Chart for PowerPoint – Visualization of Market Analysis and Performance
#Market and Competitor Analysis #Financial Plans and Performance #Graph
-

Market Status and Future Outlook – Data Illustrated in Blue and Yellow
#Market and Competitor Analysis #Graph #Market Status
