Visualizing Sales and Meeting Progress Over Time
RB0800029-1_18
- Last Update 03/24/2025
- File Size 7.4MB
- # of Slides 2
- File Format PPTX
- Slide Ratio 4:3
- Color
Keywords
- #Content-Based Slides
- #Design-Based Slides
- #Market and Competitor Analysis
- #Financial Plans and Performance
- #Graph
- #Market Status
- #Sales and Revenue
- #Line
- #Line Chart
- #4:3
- #line chart PowerPoint
- #trend analysis slide template
- #sales performance graph
- #dual-series data visualization
- #monthly comparison chart PowerPoint
About the Product
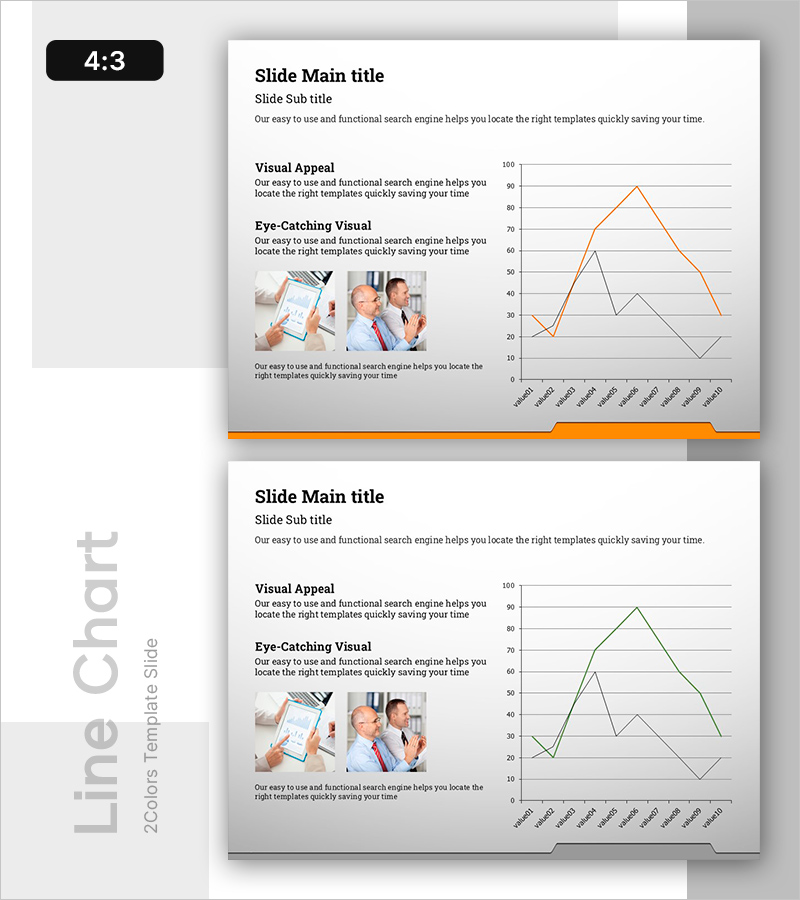
A PowerPoint slide visualizing sales and meeting progress trends using a dual-series line chart. Two data lines in orange and black represent 12-month changes, making trend analysis immediately clear. The left section features visual appeal elements and business photos, while the right graph area includes horizontal gridlines for easy value reading. This 2-slide PPTX template is ready to use in presentations and business reports.
Usage Points
-
Main Usage
Compare monthly or quarterly sales trends and meeting progress simultaneously through data visualization. Displaying two independent series on one chart enables correlation analysis and effective performance narrative.
-
How to Use
Use in financial reports, business performance presentations, and executive briefings to explain numerical changes over time. Edit chart data to represent actual revenue, customer count, project completion rate, or other KPIs.
-
Recommended For
CFOs, finance managers, sales directors, and project managers explaining performance trends to executives, investors, and team members. Ideal for quarterly reviews, annual performance analysis, and project progress updates.
-
Slide Structure
Two-slide layout with title, subtitle, descriptive text, and two business photos on the left; 12-month dual-series line chart (orange and black) on the right. Chart features Y-axis range 0–100, monthly X-axis labels, and horizontal gridlines for readability.
Related Products
-

Purple Green Flower Market Analysis – Market Status and Competitive Analysis
#Market and Competitor Analysis #Financial Plans and Performance #Graph
-

Fashion Market Sales Status Graph – Data Visualization and Trend Analysis
#Market and Competitor Analysis #Financial Plans and Performance #Graph
-

Newspaper Wide PowerPoint Template Line Chart - Market Analysis and Revenue Performance
#Market and Competitor Analysis #Financial Plans and Performance #Graph
-

Sea Lighthouse Goal Market Strategy Line Graph – Revenue and Profit Growth
#Market and Competitor Analysis #Financial Plans and Performance #Graph
