Red Blue Double Bar Graph – Data Visualization
RJ0300027_29
- Last Update 04/25/2025
- File Size 0.4MB
- # of Slides 2
- File Format PPTX
- Slide Ratio 16:9
- Color
Keywords
About the Product
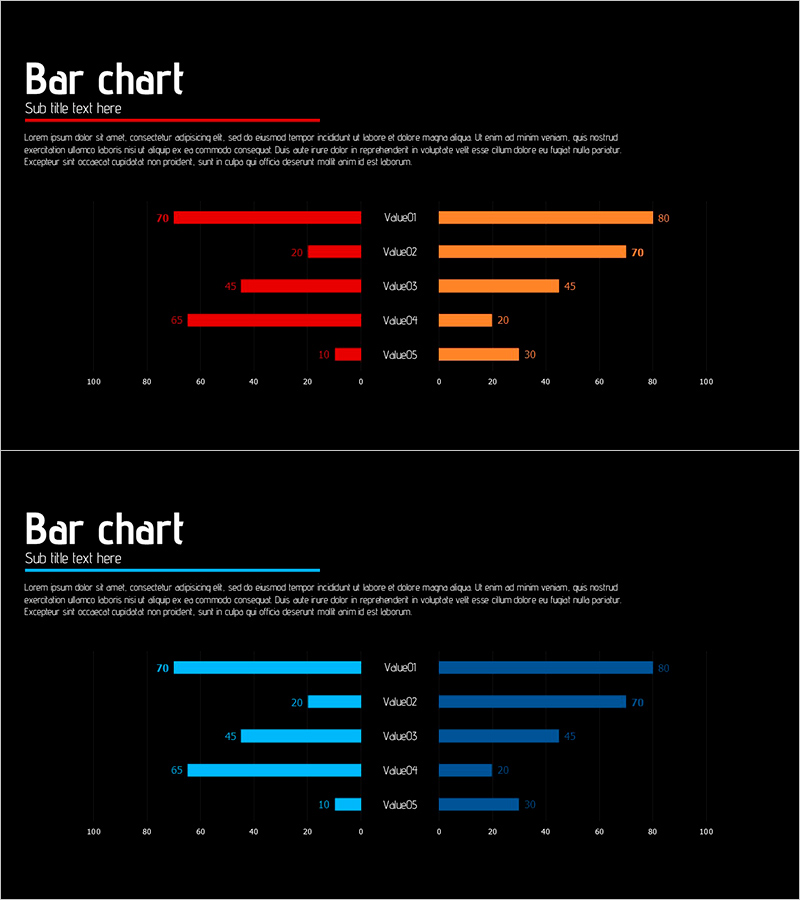
A 2-slide PowerPoint presentation featuring horizontal bar charts with dual data series in red and blue. Each slide displays 5 items with side-by-side bars for direct numerical comparison and contrast analysis. Ideal for visualizing sales figures, performance metrics, satisfaction scores, regional comparisons, and competitive benchmarking. Delivered in 16:9 widescreen PPTX format, fully editable and ready to integrate into presentations, reports, and business decks.
Usage Points
-
Main Usage
Enables side-by-side comparison of two data groups across multiple categories, making differences and trends immediately visible. Suitable for sales performance reports, regional comparisons, year-over-year analysis, competitive benchmarking, budget vs. actual reporting, and any quantitative comparison requiring clear visual contrast.
-
How to Use
Open the slide and input category names and values; bar lengths adjust automatically. Red bars appear on the left, blue bars on the right for clear contrast. All elements—colors, fonts, values, and category labels—are fully editable. Add or remove items as needed to match your data structure.
-
Recommended For
Sales and marketing teams presenting performance metrics, finance departments comparing budgets to actuals, strategy teams analyzing market data, management consultants preparing client proposals, educators explaining statistical comparisons, and business analysts presenting quantitative findings.
-
Slide Structure
2-slide set. Each slide features a horizontal axis (0–100 scale) with 5 item rows. Each row displays a red bar (left) and blue bar (right) for direct comparison. Category labels and numerical values are clearly marked for easy data interpretation.
Related Products
-

Animal Natural Environment Improvement Rate Future Outlook Horizontal Bar Chart
#Market and Competitor Analysis #Graph #Industry Trends
-

Main Business Analysis Graph – Performance Insights
#Company Introduction #Business Introduction #Diagram
-

User Analysis Graph by Age Group – Advanced Data Insights
#Market and Competitor Analysis #Diagram #Graph
-

Cargo Transportation Service Analysis Graph – Detailed Data Comparison
#Market and Competitor Analysis #Graph #Market Analysis
