Interior Demand Area Graph – Market Analysis Tool
RJ0900023_27
- Last Update 08/23/2025
- File Size 0.3MB
- # of Slides 2
- File Format PPTX
- Slide Ratio 16:9
- Color
Keywords
About the Product
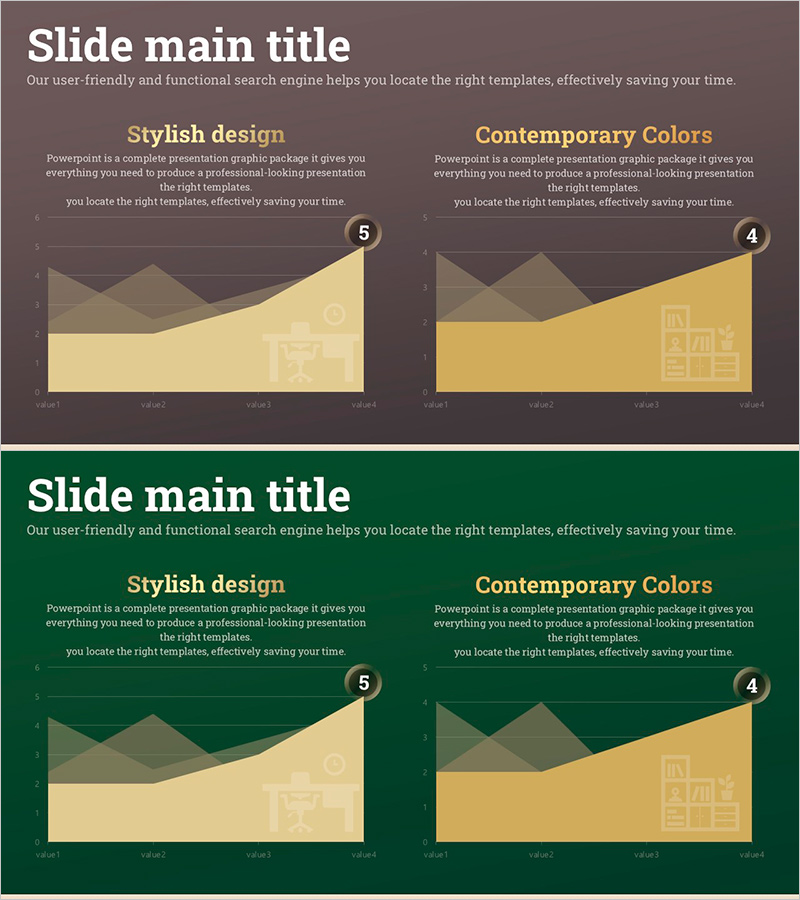
A 2-slide area chart PowerPoint presentation designed for market analysis and competitive positioning. Features a dark brown background with beige and yellow-toned wave-form area charts. The left slide showcases a stylish design with 5 data points, while the right slide presents a contemporary color layout with 4 data points. Each slide includes title and descriptive text areas along with icon elements, enabling clear visualization of market trends, demand analysis, and competitive comparisons. Delivered in 16:9 widescreen PPTX format for immediate editing and customization.
Usage Points
-
Main Usage
Visualizes quantitative market data, demand trends, and competitive comparisons using area charts to support strategic decision-making. Two distinct layouts allow the same data to be presented from multiple perspectives, maximizing presentation impact and audience comprehension.
-
How to Use
Integrate into business plans, investor pitch decks, and marketing strategy presentations within the market analysis section. Edit slide titles and descriptive text, input data values, and the chart updates automatically. Customize colors to align with your brand identity and corporate guidelines.
-
Recommended For
Executives, marketing managers, strategic planning teams, and sales leaders presenting market analysis findings to senior management, investors, and business partners. Ideal for demonstrating demand trends, market share distribution, and competitive positioning analysis.
-
Slide Structure
Each slide contains a main title at the top, left-side descriptive text area (Stylish design), right-side descriptive text area (Contemporary Colors), and two area charts in the center-bottom section. Each chart displays 4-5 data points with legends, using wave-form cumulative areas to represent data hierarchy and trends.
Related Products
-

The Importance of Modern People's Health Care – Insights from Market Analysis
#Market and Competitor Analysis #Graph #Other
-

Slanted Horizontal Bar Graph – Visual Tool for Business Strategy
#Business Strategy #Market and Competitor Analysis #Graph
-

Zombie Walking Dead Slide – Optimized for Competitor Analysis with Doughnut Chart
#Market and Competitor Analysis #Graph #Other
-

Arctic Business Competitor Analysis Pyramid Chart
#Market and Competitor Analysis #Graph #Other
