Artificial Intelligence Donut Chart Analysis – A New Standard in Data Visualization
RJ0500038_21
- Last Update 06/17/2025
- File Size 0.4MB
- # of Slides 2
- File Format PPTX
- Slide Ratio 16:9
- Color
Keywords
- #Content-Based Slides
- #Design-Based Slides
- #Technical Approach
- #Graph
- #Other
- #Service Development Plan
- #Service Operation Plan
- #Circles
- #Doughnut Chart
- #Silhouette
- #16:9
- #artificial intelligence silhouette PowerPoint
- #AI diagram slide template
- #technology visualization slides
- #head silhouette diagram
- #concentric circle PPT design
About the Product
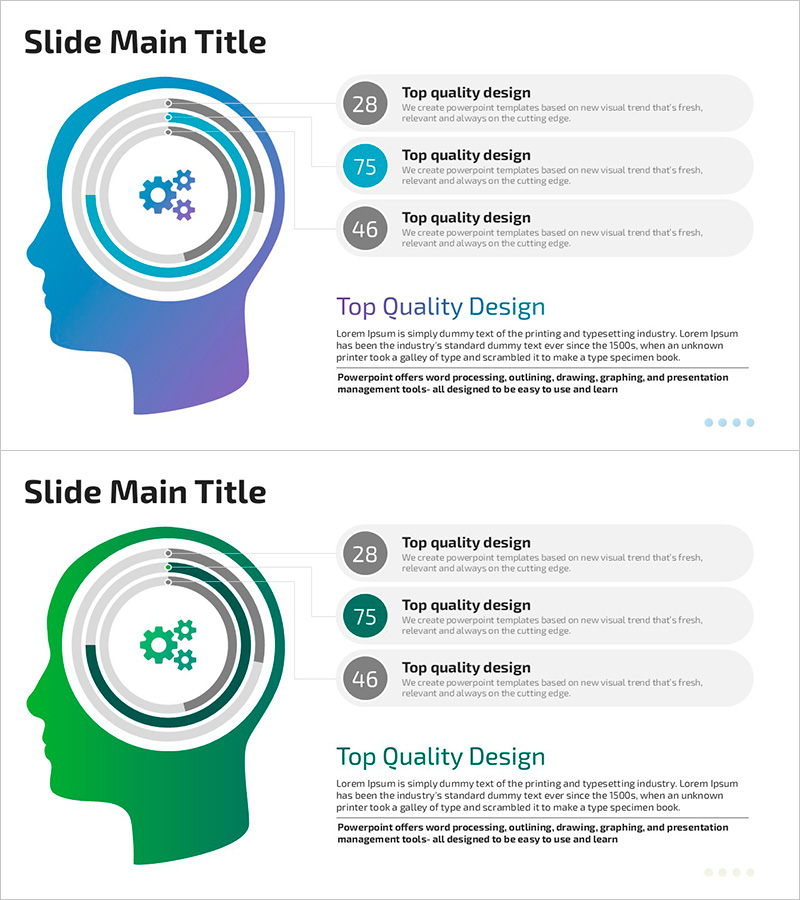
A PowerPoint slide deck visualizing artificial intelligence concepts through human head silhouette design. The silhouette features concentric circular rings and gear icons at the center, intuitively representing AI's complex cognitive architecture. A blue-to-purple gradient background conveys technological depth and innovation. This 2-slide set is ready to use in data analysis, technology introduction, and innovation strategy sections of presentations. Delivered in 16:9 widescreen PPTX format, fully editable across all presentation platforms.
Usage Points
-
Main Usage
Transforms complex AI and technology concepts into visually compelling, easy-to-understand graphics for tech presentations. The concentric circular structure within the head silhouette symbolizes hierarchical learning processes and neural network architecture, enhancing audience comprehension of abstract technological concepts.
-
How to Use
Insert into technology presentations, corporate innovation strategy decks, and AI solution pitches. Add your main message (e.g., 'AI-Powered Data Analytics', 'Next-Generation Technology Innovation') to the title area and supporting details to the right text box. The gradient background is pre-applied, enabling immediate use without additional design work.
-
Recommended For
Ideal for IT and technology company investor pitches, technology innovation strategy presentations, data science team analysis reports, and university lectures. Particularly effective for AI solution sales, technology consulting, and digital transformation initiatives where both expertise and innovation must be communicated simultaneously.
-
Slide Structure
2-slide composition with the first slide featuring a blue-gradient background, left-aligned head silhouette with 3-4 concentric rings and central gear icon, and right-aligned 3-item text box. The second slide repeats the same layout with purple-gradient background, creating a cohesive series design.
Related Products
-

Gender Ratio Customer Analysis Pie Chart – Emphasizing Customer Insights
#Market and Competitor Analysis #Graph #Other
-

Step-by-Step Gear System Presentation Template – Innovation and Efficiency
#Technical Approach #Diagram #Service Development Plan
-

Data Analysis Donut Circle Graph – The Start of Effective Visualization
#Product/Service Introduction #Technical Approach #Diagram
-

Strategy for Enhancing Reading Education for Children – Effective Cluster Diagram
#Operational Plan #Technical Approach #Diagram
