Visualizing Competitive Analysis with Table and 3 Donut Graphs
RJ0300027_16
- Last Update 04/25/2025
- File Size 0.5MB
- # of Slides 2
- File Format PPTX
- Slide Ratio 16:9
- Color
Keywords
- #Content-Based Slides
- #Design-Based Slides
- #Market and Competitor Analysis
- #Diagram
- #Graph
- #Competitor Analysis
- #Market Analysis
- #Table
- #Circles
- #Standard Table
- #Doughnut Chart
- #16:9
- #donut chart PowerPoint
- #pie graph slide template
- #competitive analysis presentation
- #data visualization PPT
- #donut graph download
- #how to create donut chart in PowerPoint
About the Product
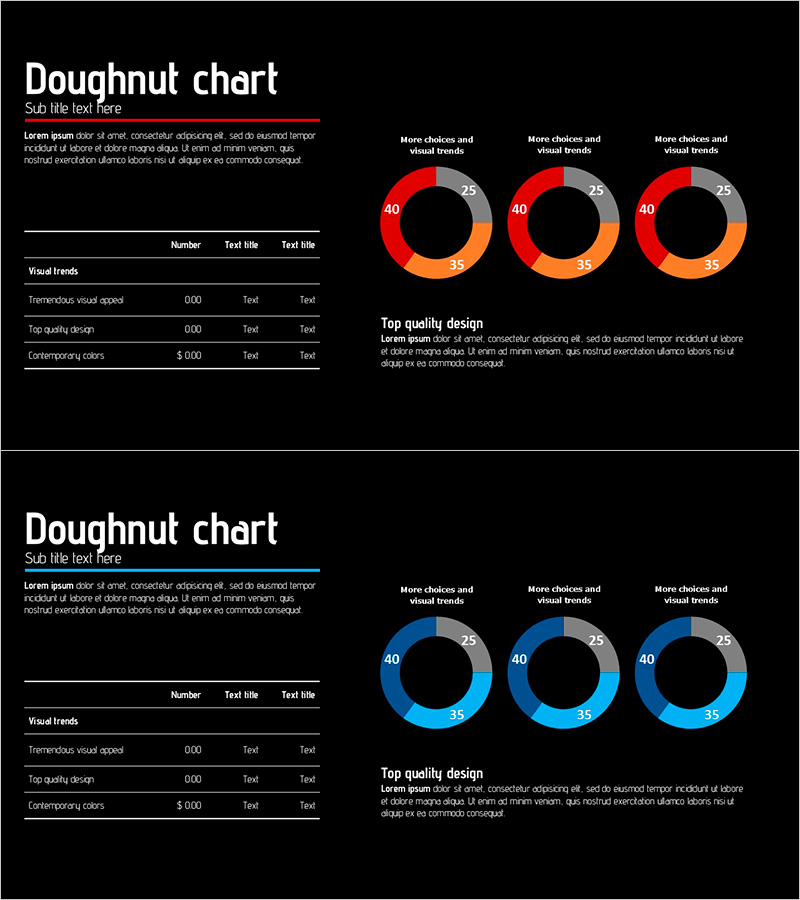
A 2-slide PowerPoint presentation for competitive analysis and comparative data visualization. Black background with three donut charts in red-orange-gray and blue-cyan-gray color schemes, paired with a data table on the left side. Each donut is divided into 40, 35, and 25 percent segments, delivering both quantitative precision and visual impact. The slides feature different color palettes to adapt to various presentation contexts. Designed in 16:9 widescreen format for modern presentation environments and fully editable in PPTX format. Ideal for business reports, market analysis, and performance comparisons.
Usage Points
-
Main Usage
Visualize quantitative data such as competitive analysis, market share comparison, and performance metrics using donut charts paired with a detailed data table. The black background and bold color contrast create high-impact presentation materials suitable for executive briefings and strategic reviews.
-
How to Use
Double-click each donut chart segment to edit values and labels with your actual data. Edit table cells to input item names and figures. Change colors by selecting shapes and using the fill options. Duplicate slides to add more comparison categories as needed.
-
Recommended For
Marketing strategy presentations, executive reports, business proposals, market analysis documents, and quarterly performance reviews. Ideal for finance, consulting, manufacturing, and retail sectors. Primary users include executives, planners, marketing teams, and sales professionals.
-
Slide Structure
Slide 1: 3 donut charts (red-orange-gray) with left-side 3-row data table / Slide 2: 3 donut charts (blue-cyan-gray) with left-side 3-row data table. Each donut divided into 40-35-25 percent segments with center black circle and numeric labels. Table structure: number, item name, value (3 columns).
Related Products
-

Market Analysis Slide Using Donut Charts and Table
#Market and Competitor Analysis #Diagram #Graph
-

Competitor Comparison Analysis Graph - A Tool for Effective Market Analysis
#Market and Competitor Analysis #Diagram #Graph
-

Industry Trend Analysis Donut Chart – Visual Trends Presentation
#Market and Competitor Analysis #Diagram #Graph
-

Blackboard and Comparison Table Chart – Optimized for Market and Competitor Analysis
#Market and Competitor Analysis #Diagram #Competitor Analysis
