Shareholder Status Analysis Donut Pie Chart – Corporate Growth and Competitive Analysis
RM0300022_7
- Last Update 02/13/2025
- File Size 0.3MB
- # of Slides 2
- File Format PPTX
- Slide Ratio 16:9
- Color
Keywords
- #Content-Based Slides
- #Design-Based Slides
- #Company Introduction
- #Market and Competitor Analysis
- #Diagram
- #Graph
- #Shareholder Structure
- #Market Analysis
- #Table
- #Circles
- #Standard Table
- #Doughnut Chart
- #16:9
- #donut pie chart PowerPoint
- #donut chart slide template
- #shareholder analysis presentation
- #ratio visualization graph
- #corporate analysis PPT template
About the Product
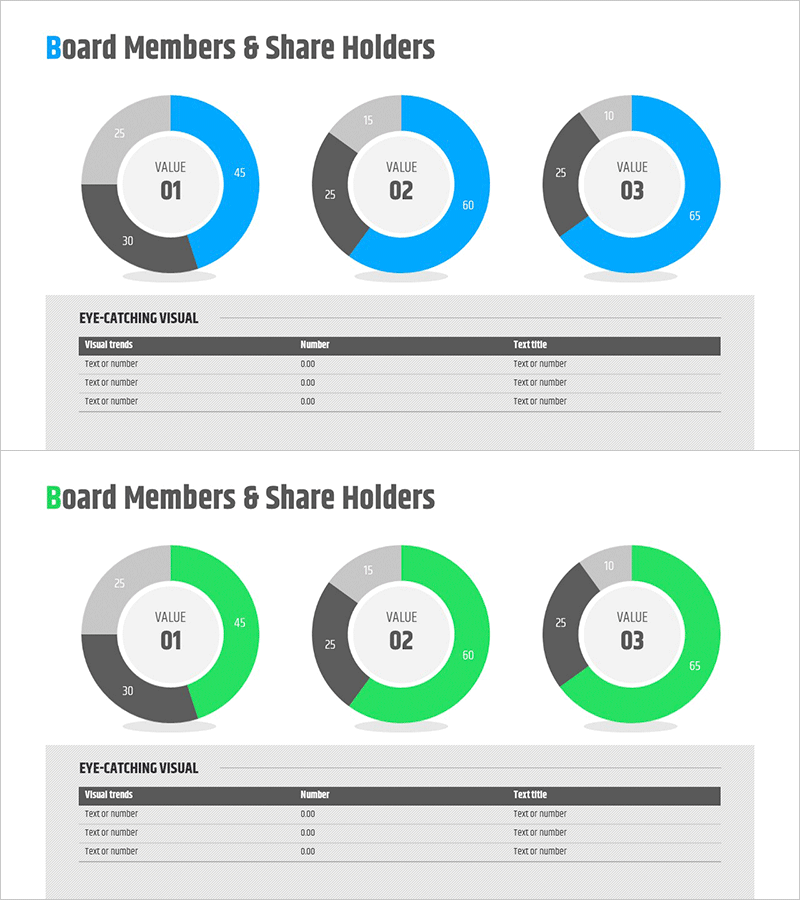
A donut pie chart PowerPoint slide designed to visualize shareholder composition and corporate growth analysis. The donut graph features a three-tone color scheme of blue, gray, and dark gray, with each VALUE segment clearly representing proportional data. The center circle area emphasizes key metrics, creating a strong visual hierarchy for data presentation. This 2-slide set is optimized for 16:9 widescreen format and supports multiple shareholder scenarios for comparative analysis. Ideal for investor relations (IR) presentations, shareholder meeting reports, and executive briefing materials.
Usage Points
-
Main Usage
Visualize shareholder composition, equity distribution, and capital structure using donut pie charts to clearly communicate with investors and stakeholders. The center VALUE area highlights key metrics, improving data readability. Multiple donut charts enable effective comparison of changes across time periods or business scenarios.
-
How to Use
Insert into IR presentations, shareholder meeting reports, and executive briefing materials in the capital structure or shareholder overview section. Edit each donut segment color to reflect actual shareholder percentages, and update the center VALUE text with company name, quarter, or scenario label. Use PowerPoint shape editing tools to freely adjust numerical values and legends.
-
Recommended For
CFOs, financial officers, investor relations (IR) specialists, corporate executives, management consultants, and financial analysts. Suitable for all presentations requiring shareholder composition analysis, capital structure explanation, and competitive comparison.
-
Slide Structure
2-slide set with 3 donut pie charts (VALUE 01, 02, 03) arranged horizontally on each slide. Each donut is divided into 3–4 segments in blue, gray, and dark gray tones. The center circle contains space for VALUE text and numerical data. A data table area labeled EYE-CATCHING VISUAL at the bottom allows additional information organization.
Related Products
-

Shareholder Status Analysis Slide – Data-Driven Market Insights
#Company Introduction #Market and Competitor Analysis #Diagram
-

Shareholder Status Detailed Analysis Pie Chart & Table – Impactful Data Visualization
#Company Introduction #Market and Competitor Analysis #Diagram
-

Status Analysis Donut Chart – Visualizing Market and Shareholder Status
#Company Introduction #Market and Competitor Analysis #Diagram
-

Shareholder Status Analysis Chart & Description – Sleek Diagram
#Company Introduction #Market and Competitor Analysis #Diagram
