Detailed Analysis of Shareholder Status Donut Chart
RM0300023_7
- Last Update 02/13/2025
- File Size 0.4MB
- # of Slides 2
- File Format PPTX
- Slide Ratio 16:9
- Color
Keywords
- #Content-Based Slides
- #Design-Based Slides
- #Company Introduction
- #Market and Competitor Analysis
- #Diagram
- #Graph
- #Shareholder Structure
- #Market Analysis
- #Table
- #Circles
- #Standard Table
- #Doughnut Chart
- #16:9
- #donut chart PowerPoint
- #shareholder composition slide
- #pie chart template
- #equity distribution PPT
- #how to create donut chart in PowerPoint
- #shareholder analysis presentation
About the Product
A professional donut chart PowerPoint slide for visualizing shareholder composition and equity distribution. This presentation template features a 4-segment donut graph with blue and green gradient colors that clearly distinguish ownership stakes at a glance. The center circular area accommodates key messages such as total capital, major shareholder names, or equity percentages. Comprising 2 slides, this deck adapts to various shareholder analysis scenarios and integrates seamlessly into company introductions, investor pitch decks, and business plans. The 16:9 widescreen PPTX format ensures compatibility across all presentation environments.
Usage Points
-
Main Usage
Visualize shareholder composition and equity distribution through a donut chart, enabling clear communication of company ownership structure to investors, employees, and business partners. The center area accommodates critical information such as total capital, major shareholder names, and equity percentages.
-
How to Use
Deploy in investor pitch presentations, company profile shareholder sections, business plan organizational structure explanations, and quarterly shareholder change analyses. Customize segment values, colors, and labels to match actual shareholder data and corporate structure.
-
Recommended For
CFOs, finance teams, and IR professionals preparing investor relations materials; company executives presenting at shareholder meetings; startups, SMEs, and public companies disclosing shareholder composition and internal reporting.
-
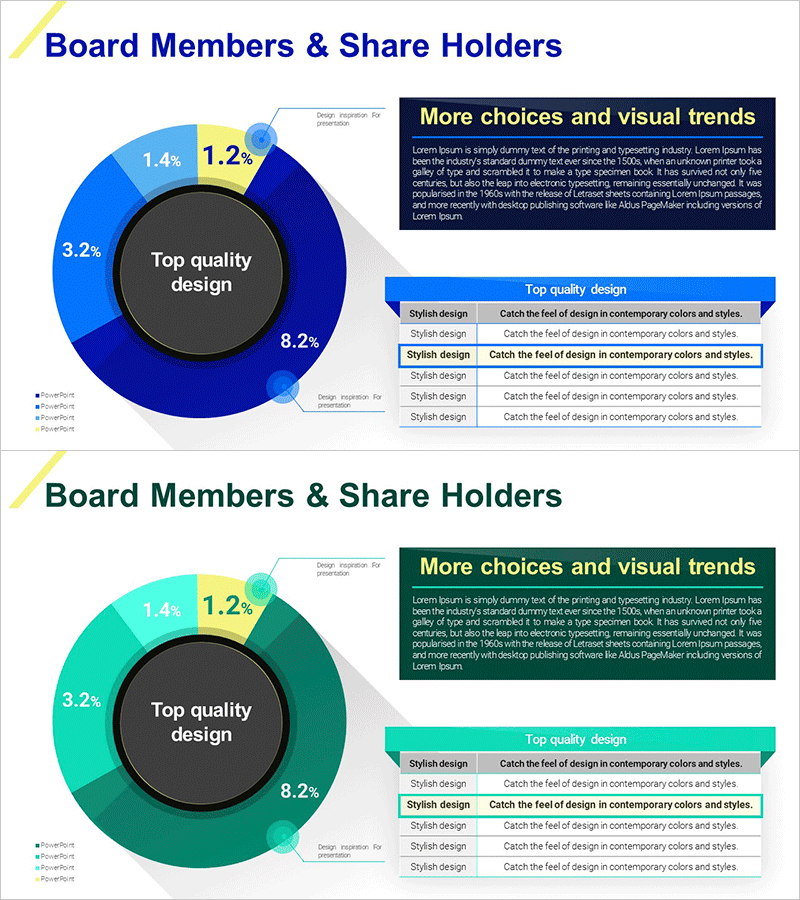
Slide Structure
Two-slide deck with 4-segment donut chart. Slide 1 features the core donut graph with blue, green, light blue, and yellow segments. Slide 2 includes legend, numerical labels, and descriptive text boxes for detailed analysis. The center circular area accepts custom text; all segments, colors, and labels are fully editable.
Related Products
-

Shareholder Status Survey Donut Graph – Optimized for Market Analysis
#Company Introduction #Market and Competitor Analysis #Diagram
-

Shareholder Status Analysis with Pie Charts and Graphs
#Company Introduction #Market and Competitor Analysis #Diagram
-

Shareholder Status Analysis Chart & Description – Sleek Diagram
#Company Introduction #Market and Competitor Analysis #Diagram
-

Shareholder Status Analysis Donut Pie Chart – Corporate Growth and Competitive Analysis
#Company Introduction #Market and Competitor Analysis #Diagram
