100% Stack Horizontal Graph – Market Trend Analysis
RJ0300027_13
- Last Update 04/25/2025
- File Size 0.4MB
- # of Slides 2
- File Format PPTX
- Slide Ratio 16:9
- Color
Keywords
- #Content-Based Slides
- #Design-Based Slides
- #Market and Competitor Analysis
- #Graph
- #Market Analysis
- #Industry Trends
- #Horizontal Bar
- #Segmented Horizontal Bar
- #16:9
- #100% stacked horizontal bar chart PowerPoint
- #ratio comparison slide
- #market analysis chart template
- #data visualization PPT
- #stacked bar graph download
- #business presentation slide
About the Product
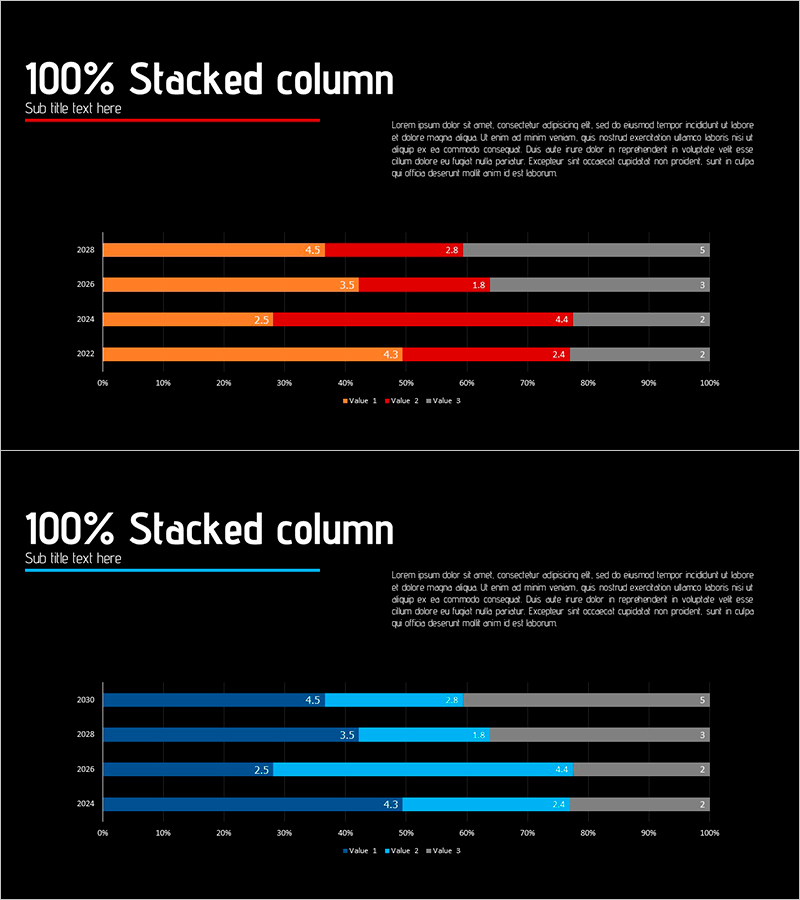
A professional 100% stacked horizontal bar chart PowerPoint slide optimized for market trend analysis and competitive comparison. The slide features three data series in orange, red, and gray colors, clearly displaying proportional relationships across multiple years from 2018 to 2030. Each bar segment includes numerical labels for precise data communication, making it ideal for executive presentations, investor pitches, and strategic analysis. The 16:9 widescreen format with black background provides high contrast and visual impact. This 2-slide template is ready to download and customize with your own data for reports, business presentations, and analytical materials.
Usage Points
-
Main Usage
Ideal for visualizing market share, revenue composition, cost allocation, and other proportional changes over time. Enables side-by-side comparison of multi-year data in a single view, making it perfect for executive briefings, investor relations, and strategic planning meetings.
-
How to Use
Each bar is divided into three segments with automatic ratio calculation based on input values. The legend is positioned at the bottom for easy reference. Simply edit the data values, customize colors, and adjust labels to match your dataset. The black background ensures excellent readability in projection environments.
-
Recommended For
Financial analysts, marketing managers, executives, management consultants, and data professionals presenting market analysis, competitive benchmarking, and performance reports. Recommended for any business presentation requiring year-over-year or period-over-period trend analysis.
-
Slide Structure
Two-slide template featuring 4 years of data (2018, 2026, 2024, 2022 or 2030, 2028, 2026, 2024) represented across three color-coded series. The horizontal axis spans 0% to 100% with numerical labels on each segment, enabling precise ratio comparison and data accuracy.
Related Products
-

Plant Horizontal Bar Chart – Understand Market Trends
#Market and Competitor Analysis #Graph #Market Analysis
-

Bar Chart Slide for Theme Park Market Trends
#Market and Competitor Analysis #Graph #Market Analysis
-

Stacked Bar Chart by Country – Visualizing Market Trends
#Market and Competitor Analysis #Graph #Other
-

Living Room Interior and Horizontal Cumulative Charts – Assessing Market Trends
#Market and Competitor Analysis #Graph #Market Analysis
