Bar Chart Slide for Theme Park Market Trends
RB0800056_6
- Last Update 03/27/2025
- File Size 20.4MB
- # of Slides 2
- File Format PPTX
- Slide Ratio 4:3
- Color
Keywords
- #Content-Based Slides
- #Design-Based Slides
- #Market and Competitor Analysis
- #Graph
- #Market Analysis
- #Industry Trends
- #Horizontal Bar
- #Segmented Horizontal Bar
- #4:3
- #horizontal bar chart PowerPoint
- #market trend analysis slide
- #data visualization template
- #bar graph presentation
- #comparative analysis chart
- #theme park market PowerPoint slide
About the Product
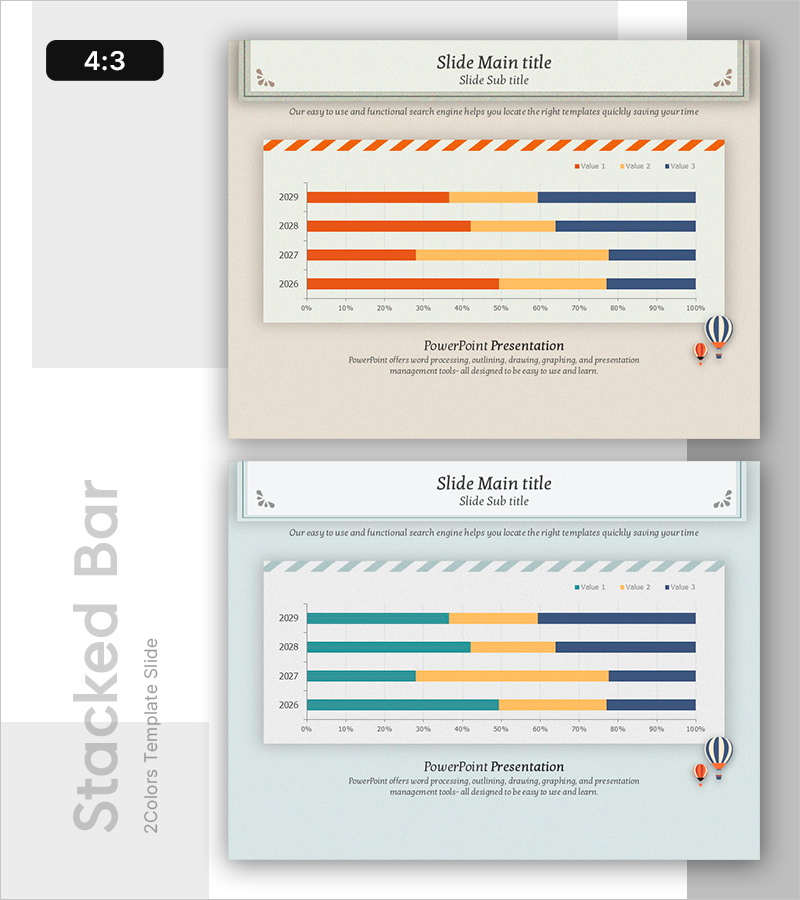
A horizontal bar chart PowerPoint slide for analyzing theme park market trends across four years (2026–2029) with three data series visualized in distinct colors (orange, beige, and navy). This presentation slide enables year-over-year market share comparison with a normalized 0–100% percentage axis, making it ideal for industry reports, market analysis presentations, and executive briefings. The slide deck is ready to download and customize for immediate use in business presentations.
Usage Points
-
Main Usage
Visualize theme park industry market trends across multiple years using three data series for comparative analysis. Effectively communicate market share, revenue trends, and customer distribution data to support strategic decision-making and stakeholder presentations.
-
How to Use
Integrate into market analysis reports, executive briefings, and investor presentations. Use the bar lengths and color coding to convey data proportions intuitively, allowing audiences to grasp year-over-year trends at a glance without detailed explanation.
-
Recommended For
Theme park and tourism industry professionals, market research analysts, business executives, industry trend specialists, and investment review teams who need to present market data clearly and persuasively to stakeholders.
-
Slide Structure
Two-slide template in 4:3 ratio PPTX format. First slide features horizontal bars in orange, beige, and navy representing 2026–2029 data with 0–100% percentage axis. Second slide offers the same structure with teal, beige, and navy color variation for design flexibility and visual interest.
Related Products
-

Stacked Bar Chart by Country – Visualizing Market Trends
#Market and Competitor Analysis #Graph #Other
-

Living Room Interior and Horizontal Cumulative Charts – Assessing Market Trends
#Market and Competitor Analysis #Graph #Market Analysis
-

100% Stack Horizontal Graph – Market Trend Analysis
#Market and Competitor Analysis #Graph #Market Analysis
-

100% Stacked Bar Chart Abstract Pattern Presentation
#Market and Competitor Analysis #Graph #Other
