Living Room Interior and Horizontal Cumulative Charts – Assessing Market Trends
RJ0900032_18
- Last Update 08/26/2025
- File Size 1.6MB
- # of Slides 2
- File Format PPTX
- Slide Ratio 16:9
- Color
Keywords
- #Content-Based Slides
- #Design-Based Slides
- #Market and Competitor Analysis
- #Graph
- #Market Analysis
- #Industry Trends
- #Horizontal Bar
- #Segmented Horizontal Bar
- #16:9
- #horizontal stacked bar chart PowerPoint
- #stacked bar graph slide template
- #data comparison chart
- #multi-series bar chart
- #how to create stacked bar chart in PowerPoint
About the Product
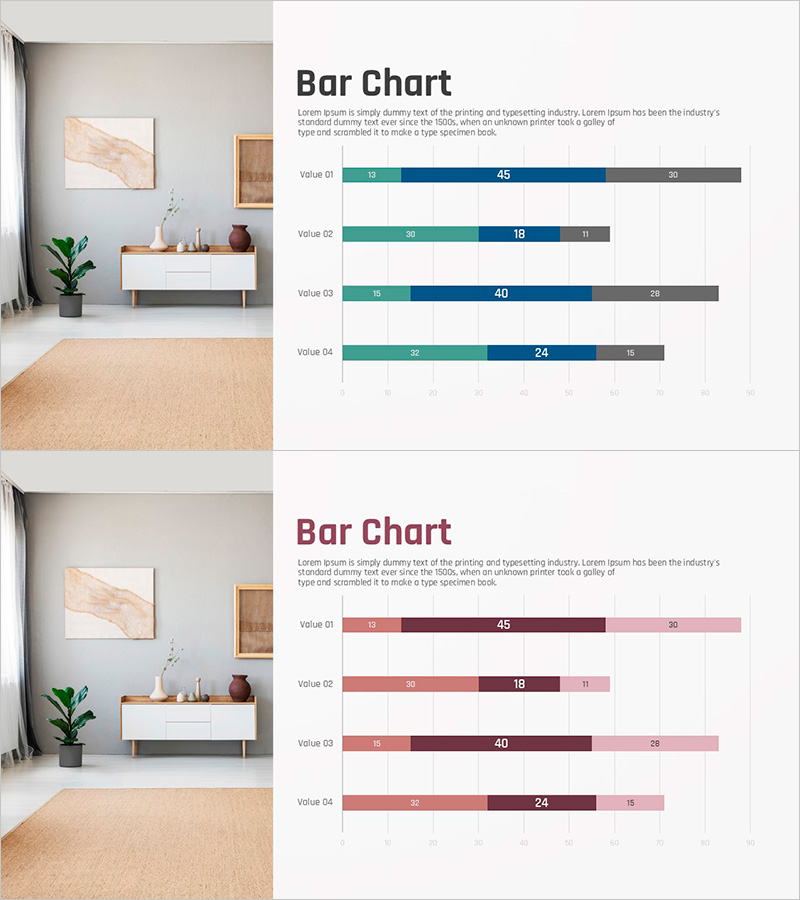
A PowerPoint slide featuring a horizontal stacked bar chart that visualizes 4 items across 3 data series. The teal, navy blue, and gray color palette creates a clear visual hierarchy for comparing both individual series values and total amounts. This chart slide is ready to use for market analysis, sales performance, budget allocation, and financial reporting presentations. The 2-slide set accommodates multiple data scenarios, and the 16:9 widescreen format ensures compatibility with modern projectors and displays.
Usage Points
-
Main Usage
Compare composition ratios and total values across multiple items simultaneously. Ideal for visualizing market trends, sales performance, budget distribution, and resource allocation to enhance audience comprehension of complex data relationships.
-
How to Use
Input your 3-series data for each item (Value 01–04) and the stacked bars automatically adjust. Maintain the color scheme while updating numbers, or modify the series count to fit different data structures.
-
Recommended For
Executive presentations, marketing teams, finance departments, and sales teams presenting quarterly reports, strategic reviews, investor meetings, and performance dashboards. Especially effective when emphasizing composition changes over time.
-
Slide Structure
4 items × 3 series stacked configuration. Each bar segments into teal (first series), navy blue (second series), and gray (third series) with numeric labels displayed in each segment. The 2-slide set allows presentation of multiple data scenarios with consistent formatting.
Related Products
-

Plant Horizontal Bar Chart – Understand Market Trends
#Market and Competitor Analysis #Graph #Market Analysis
-

Market Trend Analysis with Horizontal Bar Stacked Chart – Detailed Data Presentation
#Market and Competitor Analysis #Graph #Market Analysis
-

100% Stack Horizontal Graph – Market Trend Analysis
#Market and Competitor Analysis #Graph #Market Analysis
-

Stacked Bar Chart by Country – Visualizing Market Trends
#Market and Competitor Analysis #Graph #Other
