Snow Mountain Theme Double Bar Graph – A Tool for Visualizing Market Analysis
RJ0300026_32
- Last Update 04/24/2025
- File Size 1.4MB
- # of Slides 2
- File Format PPTX
- Slide Ratio 16:9
- Color
Keywords
- #Content-Based Slides
- #Design-Based Slides
- #Market and Competitor Analysis
- #Graph
- #Competitor Analysis
- #Market Analysis
- #Horizontal Bar
- #Double Horizontal Bar
- #16:9
- #double bar chart PowerPoint
- #horizontal bar graph template
- #comparison analysis slide
- #market analysis PPT
- #competitive analysis chart
About the Product
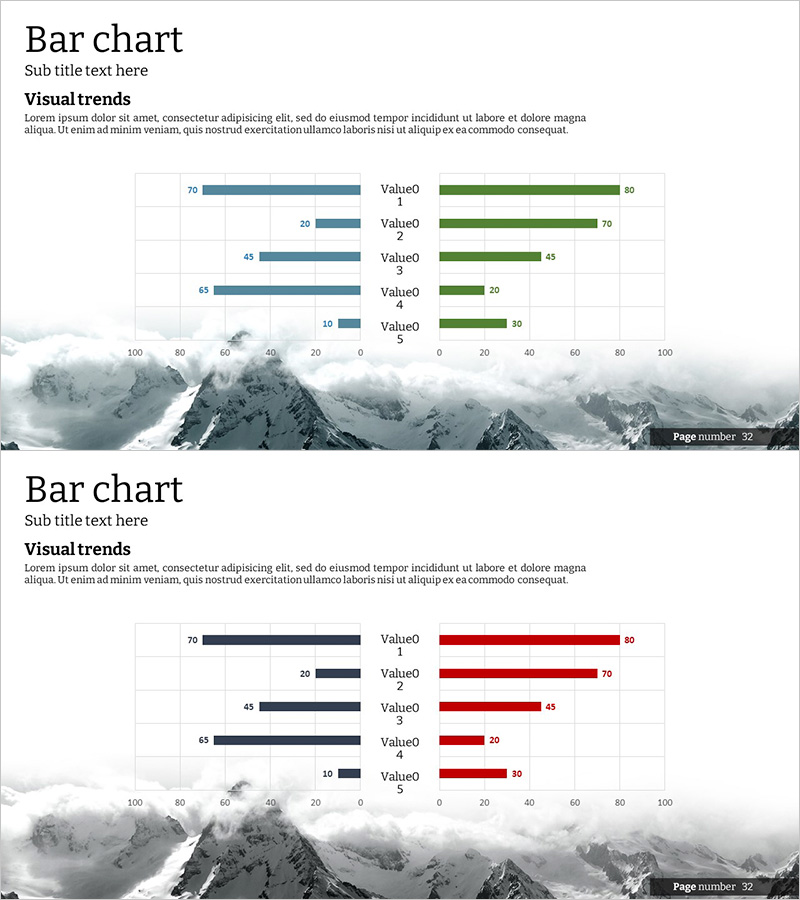
A minimalist double bar chart PowerPoint slide featuring a snow mountain background design. The chart uses contrasting blue bars on the left and green bars on the right to clearly distinguish between two data series. Five items (Value 0–5) are displayed with 100-point scale values, enabling intuitive comparison of performance metrics, competitive analysis, or market share data in a horizontal bar format. Optimized for 16:9 widescreen ratio with 2-slide composition, this template is ready for immediate use in business presentations, reports, marketing plans, and strategic documents.
Usage Points
-
Main Usage
Designed to compare two data series side-by-side across multiple categories. Ideal for competitive benchmarking, market share analysis, departmental performance comparison, and product feature comparison where quantitative data clarity is essential.
-
How to Use
Input numerical values into the left (blue) and right (green) bars for each item to create a visual comparison. During presentations, emphasize contrasts such as 'our product vs. competitor', 'target vs. actual', or 'year-over-year' performance analysis.
-
Recommended For
Marketing professionals, strategy planners, sales teams, and executive reporting. Particularly effective for market analysis, competitive positioning, performance evaluation, and product comparison presentations that require data credibility.
-
Slide Structure
2-slide composition with each slide containing a double bar chart for 5 items. Left side displays 5 blue bars, right side displays 5 green bars, with numerical labels for each value. Snow mountain background provides visual cohesion throughout.
Related Products
-

Visualizing Market and Competitor Analysis with Bilinear Bar Graph
#Market and Competitor Analysis #Graph #Competitor Analysis
-

Bilinear Bar Graph Analysis by Scientific Field - A New Paradigm in Data Visualization
#Market and Competitor Analysis #Graph #Competitor Analysis
-

Competitor Analysis Double Bar Graph
#Market and Competitor Analysis #Graph #Competitor Analysis
-

Competitor Product Analysis and Competitive Advantage Bar Chart – Market Share Comparison
#Market and Competitor Analysis #Graph #Competitor Analysis
