Visualizing Market and Competitor Analysis with Bilinear Bar Graph
RJ0300019_17
- Last Update 04/22/2025
- File Size 11MB
- # of Slides 2
- File Format PPTX
- Slide Ratio 16:9
- Color
Keywords
- #Content-Based Slides
- #Design-Based Slides
- #Market and Competitor Analysis
- #Graph
- #Competitor Analysis
- #Market Analysis
- #Horizontal Bar
- #Double Horizontal Bar
- #16:9
- #horizontal bar chart PowerPoint
- #dual-axis comparison slide
- #competitor analysis template
- #market analysis chart
- #bar graph PowerPoint slide template
About the Product
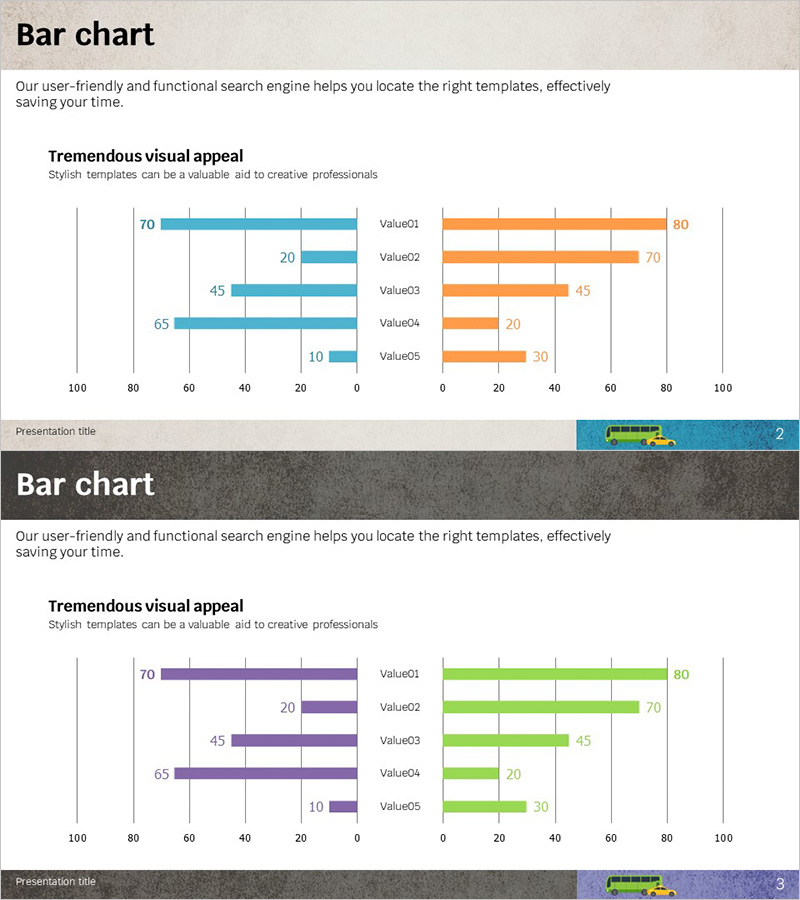
A horizontal bar chart PowerPoint slide optimized for market analysis and competitor comparison. This presentation template features a dual-axis design with blue bars on the left and orange bars on the right, enabling side-by-side comparison of five data points (70, 20, 45, 65, 10). The horizontal bar layout makes numerical comparisons intuitive and visually clear. Delivered as a 2-slide PPTX template in 16:9 widescreen format, fully editable and ready to customize. Perfect for business strategy presentations, quarterly performance reports, competitive analysis meetings, investor pitches, and client proposals.
Usage Points
-
Main Usage
This slide specializes in visualizing side-by-side data comparisons. Ideal for contrasting competitor performance vs. your company, market share comparisons, product feature benchmarking, regional sales analysis, or any scenario requiring simultaneous display of two data series. The distinct blue and orange color scheme ensures immediate visual differentiation between the two data sets.
-
How to Use
Replace the item labels (Value01–Value05) and numerical values (70, 20, 45, 65, 10) with your own data. Assign the left blue bars to your baseline metric (competitor, previous quarter, alternative product) and the right orange bars to your comparison metric (your company, current quarter, your product). The bar lengths and values update automatically when you modify the data.
-
Recommended For
Marketing managers, sales executives, strategy planners, financial analysts, and consultants who rely on data-driven decision-making. Suitable for business plan presentations, quarterly performance reviews, competitive analysis sessions, investor relations meetings, and customer proposal presentations across various industries.
-
Slide Structure
The template consists of 2 slides with identical dual-axis bar chart layouts. Each slide displays 5 data items with blue horizontal bars on the left (0–100 scale) and corresponding orange bars on the right. The central axis creates a symmetrical structure, with numerical values displayed at the end of each bar. Title and legend areas are included for additional context and annotations.
Related Products
-

Snow Mountain Theme Double Bar Graph – A Tool for Visualizing Market Analysis
#Market and Competitor Analysis #Graph #Competitor Analysis
-

Competitor Analysis Double Bar Graph
#Market and Competitor Analysis #Graph #Competitor Analysis
-

Bilinear Bar Graph Analysis by Scientific Field - A New Paradigm in Data Visualization
#Market and Competitor Analysis #Graph #Competitor Analysis
-

Competitor Analysis and Advantage Chart – The Harmony of Blue and Red
#Market and Competitor Analysis #Graph #Competitor Analysis
