Table Chart & Clustered Column Graph – Market and Competitor Analysis
RJ0400018_23
- Last Update 05/22/2025
- File Size 0.3MB
- # of Slides 2
- File Format PPTX
- Slide Ratio 16:9
- Color
Keywords
- #Content-Based Slides
- #Design-Based Slides
- #Market and Competitor Analysis
- #Diagram
- #Graph
- #Competitor Analysis
- #Market Analysis
- #Table
- #Column
- #Standard Table
- #Grouped Column
- #16:9
- #table chart PowerPoint
- #clustered column chart slide
- #competitor analysis presentation
- #market analysis template
- #data comparison PowerPoint slide
About the Product
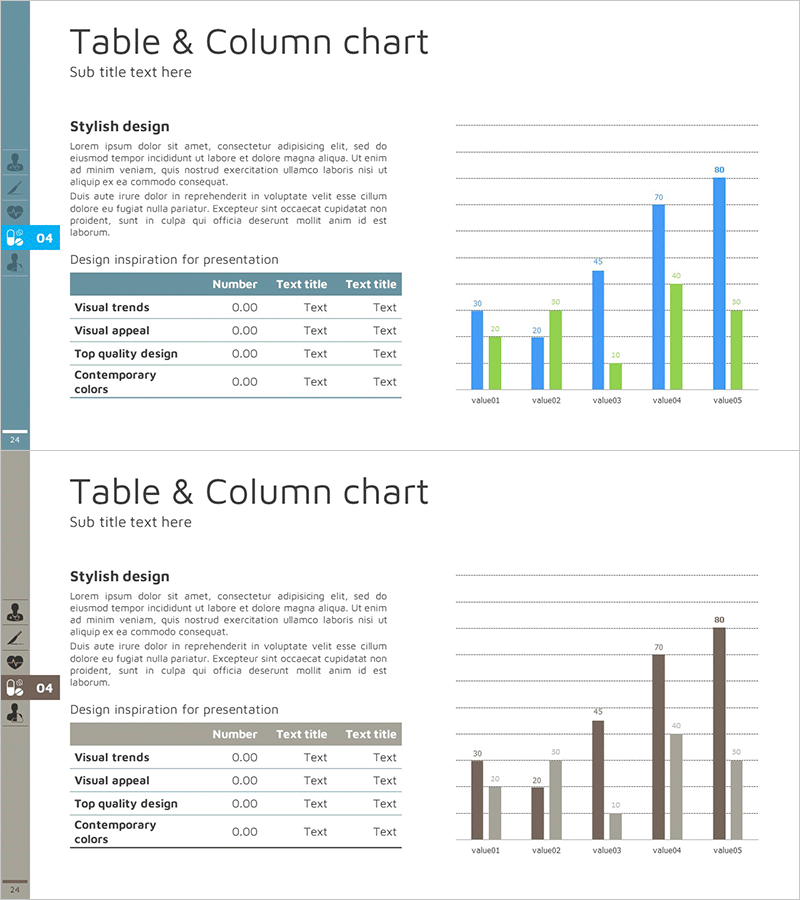
A PowerPoint slide combining data table and clustered column chart, optimized for market analysis and competitor comparison. The left table features a 4-row, 3-column structure for organizing key metrics, while the right chart displays 5 items with blue and green series side-by-side for direct comparison. Designed in 16:9 widescreen format for clear presentation on modern displays. Enables simultaneous visualization of numerical data and text for strategic decision-making presentations.
Usage Points
-
Main Usage
Present multi-dimensional data through integrated table and chart visualization, providing quantitative evidence for market size, competitor performance, and product specification comparisons. Suitable for executive reports, investor presentations, and strategic planning meetings requiring clear metric communication.
-
How to Use
Input comparison items and values in the left table, then modify chart data values for immediate updates. Blue and green series distinguish between two categories (your company vs. competitors, current vs. target). Adjust colors and fonts in slide master to match corporate branding guidelines.
-
Recommended For
Marketing managers, strategy planners, sales executives, and financial analysts preparing quarterly reports, performance presentations, and business proposals. Particularly recommended for competitive landscape analysis, market share comparison, and product performance benchmarking slides.
-
Slide Structure
2-slide set: First slide features blue and green 2-series clustered column chart (5 value items with 2 data points each); second slide uses brown and gray tones with identical structure. Both slides include 4-row, 3-column data table on left side. Optimized for 16:9 widescreen format with balanced spacing and grid alignment.
Related Products
-

Competitor Comparison Analysis Graph - A Tool for Effective Market Analysis
#Market and Competitor Analysis #Diagram #Graph
-

3D Printing Market Analysis Graph
#Market and Competitor Analysis #Diagram #Graph
-

Note Illustration Theme Chart – Market Analysis and Competitor Insights Tool
#Market and Competitor Analysis #Diagram #Graph
-

Performance Analysis Table Slide – Market and Competitor Analysis
#Market and Competitor Analysis #Diagram #Graph
