Competitor Analysis Double Bar Graph
RJ0300038_12
- Last Update 10/28/2025
- File Size 0.8MB
- # of Slides 2
- File Format PPTX
- Slide Ratio 16:9
- Color
Keywords
About the Product
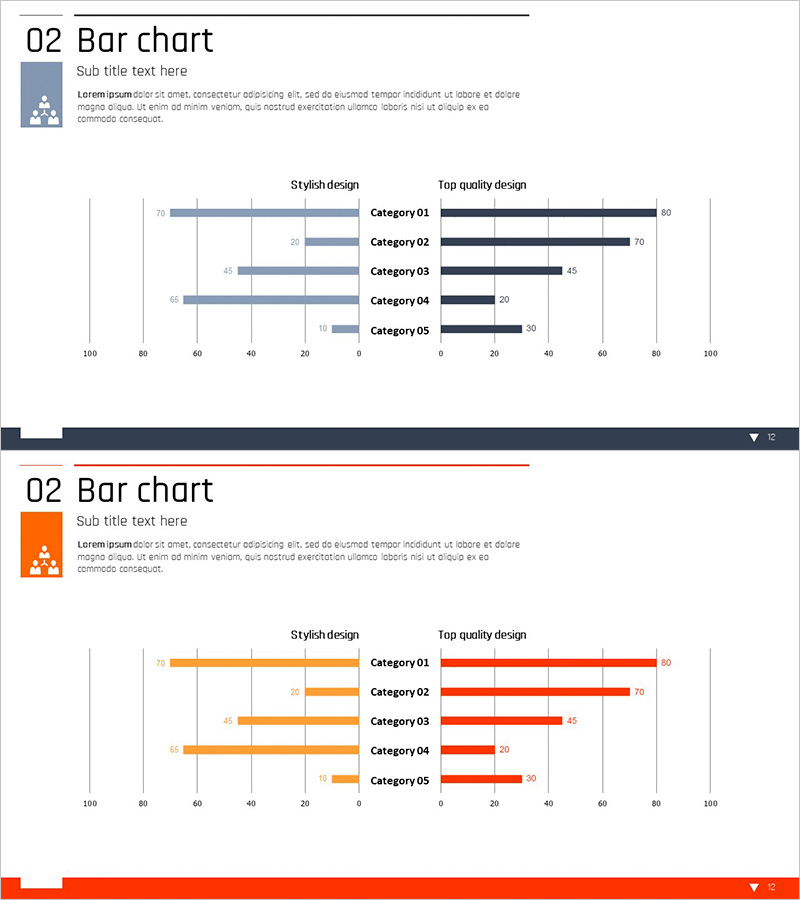
A dual horizontal bar chart PowerPoint slide optimized for competitive analysis and market comparison. This template features two design versions: a stylish design on the left (gray tone) and a top-quality design on the right (black and gray two-tone). Each version displays five categories with symmetrical left-right bar pairs, enabling side-by-side comparison of competitor performance, scores, and metrics. Clear 0-100 scale axes and data labels make it immediately ready for presentations and reports without additional formatting.
Usage Points
-
Main Usage
This slide is designed to compare two or more data series side by side across multiple categories. Perfect for competitive performance benchmarking, product feature comparison, market share analysis, departmental performance review, and any quantitative comparison presentation requiring clear visual contrast.
-
How to Use
Simply double-click the category labels and numerical values to edit them directly. Choose the stylish version (left) for team meetings and seminars, or the top-quality version (right) for executive briefings and investor presentations. Colors and axis ranges can be freely adjusted to match your brand guidelines.
-
Recommended For
Marketing strategists, sales managers, business analysts, management consultants, financial analysts, and professionals who regularly create comparative analysis materials. Ideal for business plans, quarterly performance reports, competitive analysis documents, and proposal presentations.
-
Slide Structure
2-slide set. Each slide displays 5 categories (Category 01–05) with symmetrical horizontal bars. Left data series (stylish version in gray) and right data series (top-quality version in black and gray) are positioned on a 0–100 scale axis for intuitive side-by-side comparison.
Related Products
-

Visualizing Market and Competitor Analysis with Bilinear Bar Graph
#Market and Competitor Analysis #Graph #Competitor Analysis
-

Snow Mountain Theme Double Bar Graph – A Tool for Visualizing Market Analysis
#Market and Competitor Analysis #Graph #Competitor Analysis
-

Bilinear Bar Graph Analysis by Scientific Field - A New Paradigm in Data Visualization
#Market and Competitor Analysis #Graph #Competitor Analysis
-

Blue Orange Bundle Bar Graph - Insights for Market Analysis
#Market and Competitor Analysis #Graph #Competitor Analysis
