Snow Mountain Theme Broken Line Graph – Market Status Analysis
RJ0300026_24
- Last Update 04/24/2025
- File Size 2MB
- # of Slides 2
- File Format PPTX
- Slide Ratio 16:9
- Color
Keywords
About the Product
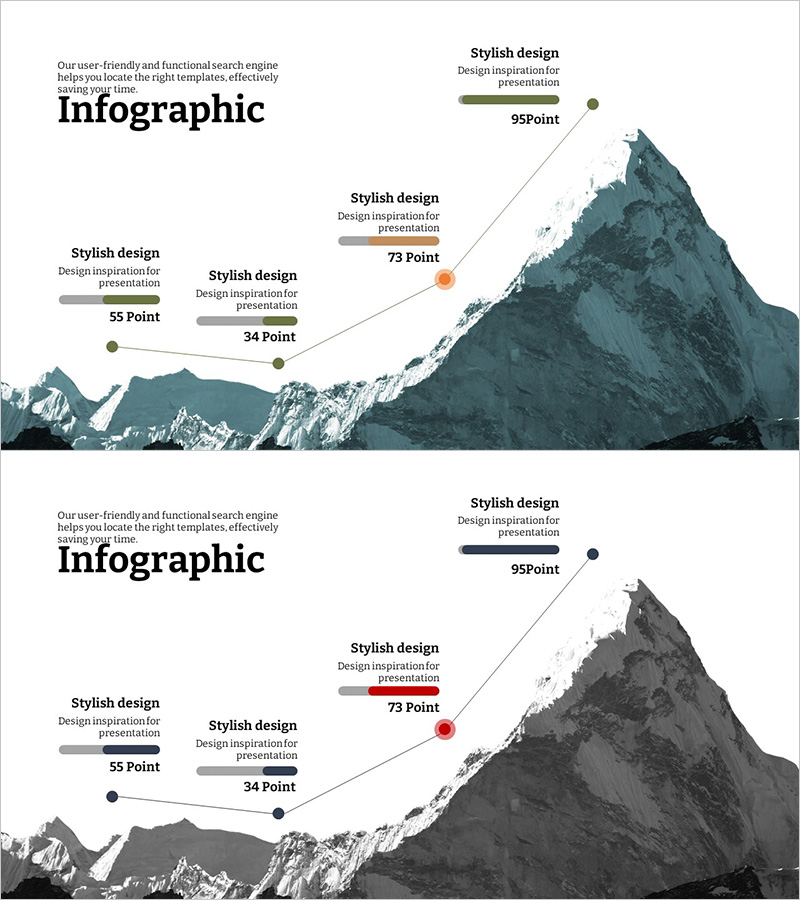
A line graph PowerPoint slide featuring a snow-capped mountain landscape background. This presentation template visualizes four data points (55, 34, 73, 95) connected by a rising trend line, ideal for market analysis, performance metrics, and growth indicators. White and orange accent markers clearly highlight each data point, with gray labels displaying numerical values. The 16:9 widescreen format includes 2 slides ready for immediate use in business presentations, reports, and pitch decks.
Usage Points
-
Main Usage
Visualizes numerical changes over time such as market trends, sales performance, and key metrics using a line chart format. Effectively communicates upward, downward, and fluctuating trends, making it ideal for quarterly comparisons and year-over-year analysis.
-
How to Use
Use in business reports, marketing analysis presentations, financial updates, and strategy meetings to demonstrate performance metrics and market dynamics. The mountain background complements nature, environment, and global business topics. Edit data values directly to reflect actual figures and customize labels as needed.
-
Recommended For
Finance teams, marketing professionals, executives, consultants, and data analysts benefit from this template. Suitable for quarterly earnings presentations, market research findings, ROI analysis, customer satisfaction trends, and other quantitative performance reporting scenarios.
-
Slide Structure
Two-slide set featuring a snow mountain landscape background with a 4-point line graph (55, 34, 73, 95 values). Each slide includes gray horizontal bar labels and circular markers (gray and orange) emphasizing data points. Left side contains 'Infographic' title and descriptive text area for context and insights.
Related Products
-

Market Analysis Broken Line Graph – Visualizing Business Performance
#Business Strategy #Market and Competitor Analysis #Graph
-

Visualizing Use of Transportation for Overseas Travel – Market Status Analysis
#Market and Competitor Analysis #Graph #Market Status
-

Sea Lighthouse Goal Market Strategy Line Graph – Revenue and Profit Growth
#Market and Competitor Analysis #Financial Plans and Performance #Graph
-

Green Analysis Chart for Market Overview – Effective Data Comparison
#Market and Competitor Analysis #Diagram #Graph
