Line Graph Slide Visualizing Ocean Market Trends
RJ0600081_25
- Last Update 07/12/2025
- File Size 1.8MB
- # of Slides 2
- File Format PPTX
- Slide Ratio 16:9
- Color
Keywords
- #Content-Based Slides
- #Design-Based Slides
- #Market and Competitor Analysis
- #Graph
- #Market Status
- #Future Outlook
- #Line
- #Line Chart
- #16:9
- #line graph PowerPoint slide
- #market trends chart template
- #dual-series line chart
- #time-series data visualization
- #ocean industry PPT
- #competitive analysis slide template
About the Product
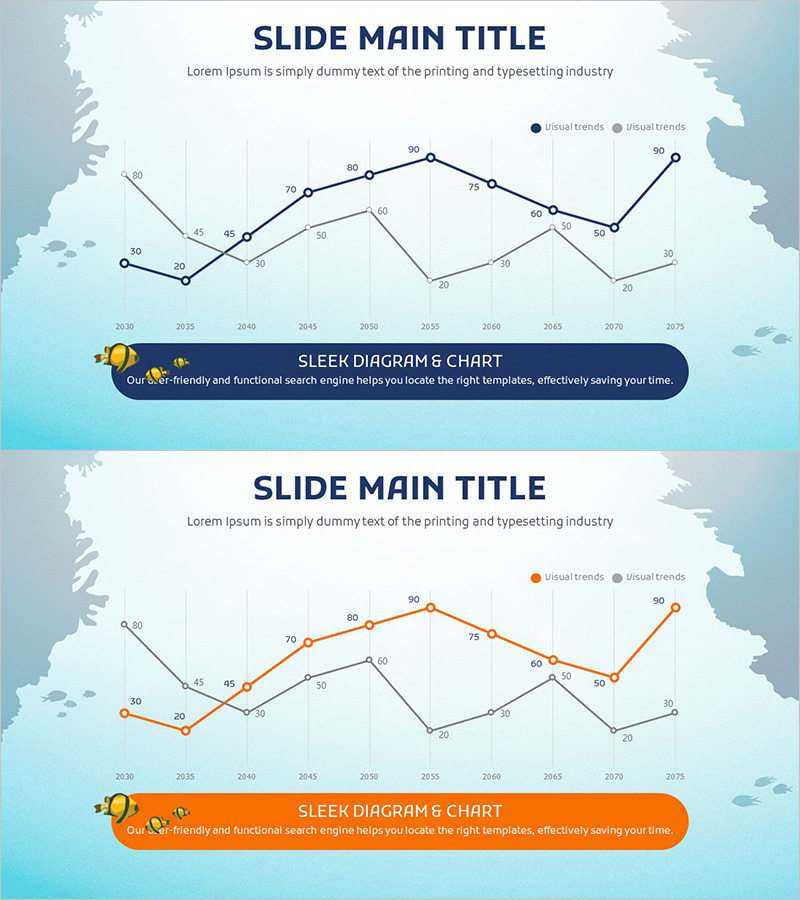
A PowerPoint slide template visualizing ocean industry market trends through dual-series line graphs spanning 2020 to 2075. The design features a light blue background with world map silhouettes, emphasizing the global context of maritime markets. Black and gray line series create strong contrast for enhanced data readability, while data points are clearly marked along the timeline. Each series tracks distinct trajectory patterns, making comparative analysis intuitive. Ideal for business presentations, market analysis reports, competitive landscape assessments, and investor pitch decks requiring time-series trend visualization.
Usage Points
-
Main Usage
Visualizes market dynamics and competitive positioning over extended time periods using two or more data series. Effectively communicates growth trajectories, market share evolution, and performance comparisons in maritime, fisheries, and shipping industries to stakeholders and investors.
-
How to Use
Insert into market analysis sections of business plans, investor presentations, quarterly earnings reports, and strategic planning documents. Easily edit data values, axis labels, and legend entries to reflect actual metrics. Color schemes can be customized to match corporate branding or highlight specific data series.
-
Recommended For
Maritime industry executives, shipping company managers, fisheries business leaders, market research analysts, investor relations professionals, management consultants, and academic presenters communicating market performance and competitive trends.
-
Slide Structure
Two-slide template set. First slide features black-series dual line graphs; second slide presents orange-series variants for visual flexibility. Both include X-axis (years 2020–2075), Y-axis (values 0–90), dual-series legend, world map background, and 16:9 widescreen formatting for seamless integration into presentations.
Related Products
-

Two Comparison Line Graphs – Market Status and Future Outlook
#Market and Competitor Analysis #Graph #Market Status
-

Simple Circle Presentation Template Line Chart – Visualizing Market Status
#Market and Competitor Analysis #Graph #Market Status
-

Four Color Infographic Presentation Template – Market Status and Forecast
#Market and Competitor Analysis #Graph #Market Status
-

Electricity and Water Usage Graphs – Market Status and Future Trends
#Market and Competitor Analysis #Graph #Market Status
