Smoker Analysis Silhouette & Segmentation Graph – The First Step to Customer Understanding
RJ0400037_11
- Last Update 05/27/2025
- File Size 5.7MB
- # of Slides 2
- File Format PPTX
- Slide Ratio 16:9
- Color
Keywords
- #Content-Based Slides
- #Design-Based Slides
- #Market and Competitor Analysis
- #Graph
- #Customer Analysis
- #Column
- #Other
- #Segmented Column
- #Other Charts
- #16:9
- #stacked column chart PowerPoint
- #segmented bar graph slide
- #silhouette infographic template
- #data comparison presentation
- #customer analysis PPT slide
About the Product
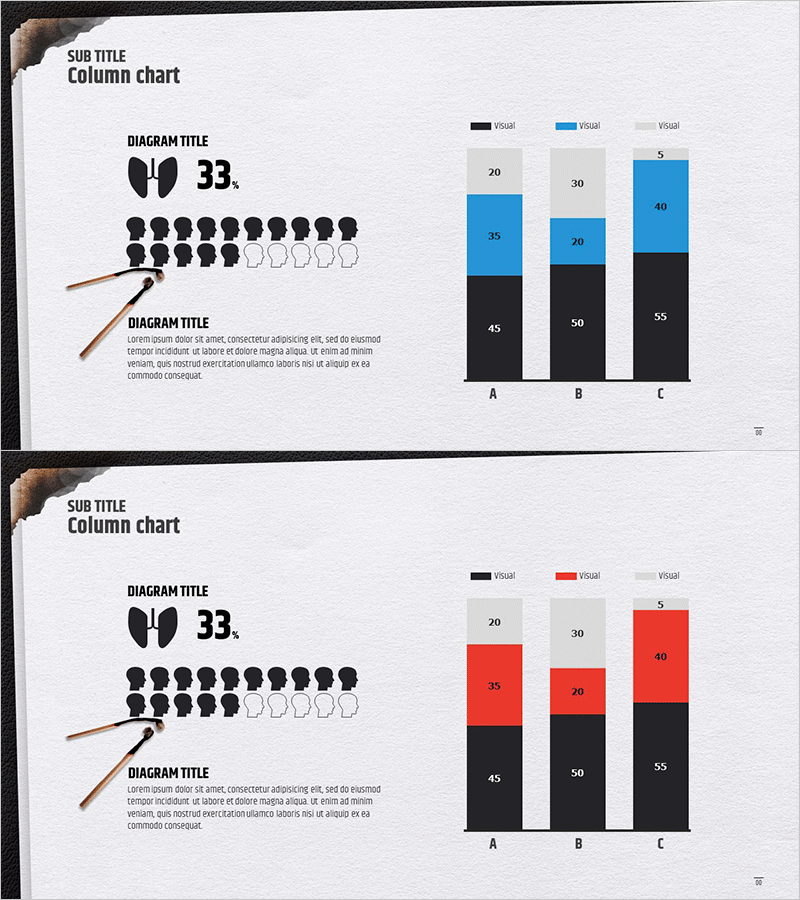
A professional PowerPoint slide designed for customer analysis and market research presentations. The stacked column chart features three color-coded series (black, blue, and red) comparing data across three categories (A, B, C) with layered values, while the left-side silhouette infographic displays 33 human icons representing sample size and population distribution. Available in 16:9 widescreen format with 2 fully editable slides, perfect for customer segmentation, market analysis, organizational structure, and demographic reporting.
Usage Points
-
Main Usage
Display multi-layered data comparisons across categories while simultaneously showing sample size and population distribution through silhouette icons. Ideal for presenting customer segmentation, market analysis results, and organizational composition in a single, cohesive visual.
-
How to Use
Input your sample size into the left silhouette infographic, then replace the chart values with your own data. Maintain the three-color legend (black, blue, red) or customize with your brand colors. Add titles and descriptive text to match your presentation context and messaging.
-
Recommended For
Marketing, sales, HR, and executive teams preparing customer or employee analysis reports. Particularly effective when presenting market research findings, customer segmentation strategies, organizational demographics, or any analysis requiring both quantitative data and visual population representation.
-
Slide Structure
Slide 1: Stacked column chart with 3 series (black, blue, gray) across 3 categories (A, B, C) with 3-level data values, plus 33-person silhouette icons on left. Slide 2: Stacked column chart with 3 series (black, red, gray) in identical structure with matching silhouette display. Both slides include color legend and title area.
Related Products
-

Medical Services Characteristics Connection Diagram
#Market and Competitor Analysis #Graph #Customer Analysis
-

Customer Analysis Diagram & Segmentation Graph – In-depth Market Insights
#Market and Competitor Analysis #Graph #Customer Analysis
-

Infographic Slide - Smartwatch Design
#Business Introduction #Market and Competitor Analysis #Graph
-

Aurora Camping Customer Analysis Chart
#Market and Competitor Analysis #Graph #Market Share
