Infographic Slide for User Gender Analysis
RJ0300026_15
- Last Update 04/24/2025
- File Size 1.4MB
- # of Slides 2
- File Format PPTX
- Slide Ratio 16:9
- Color
Keywords
About the Product
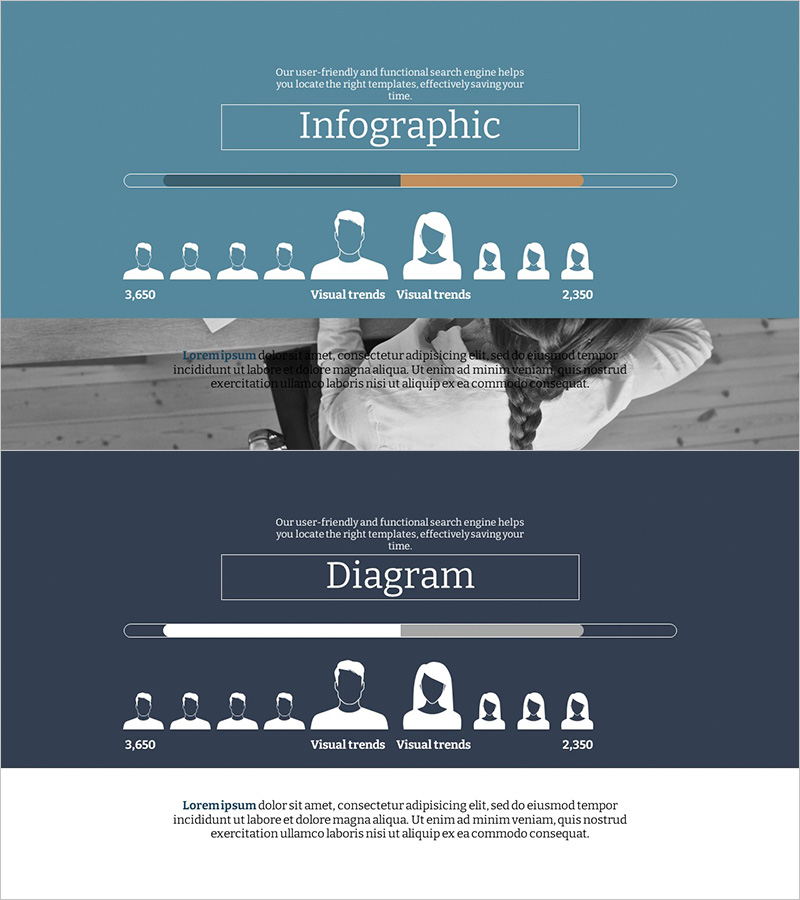
A 2-slide infographic PowerPoint presentation for user gender analysis with a blue-toned background, white icons, and orange accent colors in a minimal layout. The slides visually compare 3,650 male users on the left with 2,350 female users on the right using a progress bar and nine user avatars arranged hierarchically. The clear separation between descriptive text and numerical data makes it easy to edit and customize for customer analysis, market research, and marketing presentations. Optimized for 16:9 widescreen format, these slides work seamlessly with modern projectors and online presentations.
Usage Points
-
Main Usage
Visualize customer gender distribution at a glance and support data-driven decision-making. These slides serve as key visual evidence in marketing strategy development, target audience analysis, and market segmentation presentations.
-
How to Use
The first slide displays the 'Infographic' title with a progress bar and gender-separated user icons for comparison. The second slide repeats the same layout under 'Diagram' to reinforce comparative analysis. Insert your company data into the top description text and bottom detail sections for immediate presentation use.
-
Recommended For
Ideal for marketing team customer analysis presentations, executive reports on market analysis sections, and investor pitch decks showing target customer demographics. Suitable for gender-based customer segmentation, user statistics analysis, and any presentation requiring quantitative gender comparisons.
-
Slide Structure
Two-slide layout with each slide containing a title box (Infographic/Diagram), a central progress bar (0-100% scale), nine user avatars (gender-differentiated), left and right numerical indicators (3,650 / 2,350), and a bottom text description area. Blue, gray, and orange colors create clear information hierarchy across both slides.
Related Products
-

Customer Analysis Donut Chart - Visualizing Market Share
#Market and Competitor Analysis #Graph #Other
-

Gender Analysis Graphs for Notepad Frames – Captivating Visuals
#Market and Competitor Analysis #Graph #Other
-

Service User Ratio Analysis Infographic – Red and Blue
#Market and Competitor Analysis #Graph #Other
-

Consumer Analysis Donut & Mixed Chart – Insights into Customers
#Business Introduction #Market and Competitor Analysis #Graph
