Customer Evaluation and Feedback on Renewable Energy Business - Doughnut Chart
RJ0600048_7
- Last Update 07/03/2025
- File Size 1.8MB
- # of Slides 2
- File Format PPTX
- Slide Ratio 16:9
- Color
Keywords
- #Content-Based Slides
- #Design-Based Slides
- #Market and Competitor Analysis
- #Customer Success Stories
- #Graph
- #Other
- #Customer Analysis
- #Customer Testimonials and Feedback
- #Circles
- #Doughnut Chart
- #16:9
- #doughnut chart PowerPoint
- #donut graph slide template
- #ratio comparison presentation
- #pie chart PowerPoint template
- #customer evaluation chart
- #data visualization slides
About the Product
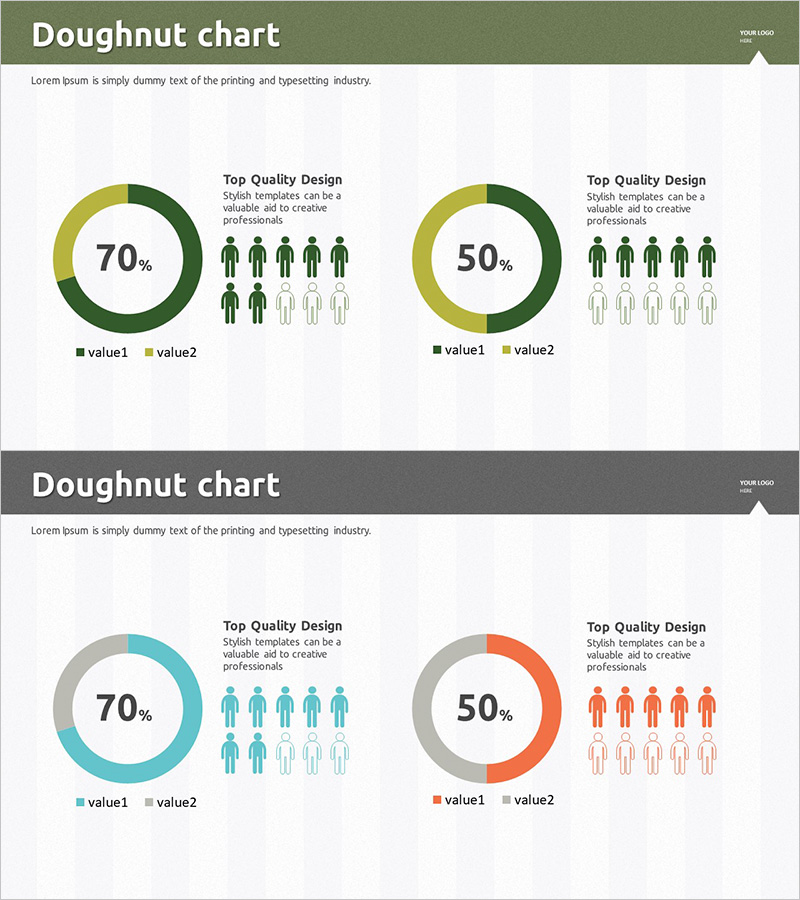
A professional doughnut chart PowerPoint slide set for visualizing customer evaluation and feedback on renewable energy initiatives. This 2-slide template features dual ratio representations (70% and 50%) rendered in green-yellow and blue-orange color palettes. Each slide positions a prominent central percentage figure, surrounded by legend labels and human icons for clear information hierarchy. Ideal for presenting customer satisfaction metrics, market share distribution, energy efficiency comparisons, and stakeholder feedback. The 16:9 widescreen format ensures seamless integration into modern presentation environments and corporate reporting workflows.
Usage Points
-
Main Usage
Doughnut charts excel at emphasizing part-to-whole relationships and proportional data. This template enables simultaneous comparison of two key metrics—such as customer satisfaction scores, market penetration rates, or energy efficiency ratings—with a dominant central figure that anchors viewer attention. The accompanying legend and icon set clarify data meaning and context.
-
How to Use
Deploy this template in renewable energy business presentations, customer satisfaction reports, market analysis decks, and stakeholder feedback summaries. Slide 1 defaults to 70% ratio; Slide 2 to 50%. Simply edit the percentage values, color segments, and legend labels to match your actual data. Icons and descriptive text are fully customizable to reflect your specific use case.
-
Recommended For
Ideal for renewable energy companies, sustainability-focused organizations, and enterprises presenting customer feedback or market metrics. Suitable for executive briefings, investor pitch decks, marketing strategy documents, business performance reports, and quarterly stakeholder communications. Works well in energy sector analyses, customer satisfaction surveys, and competitive positioning presentations.
-
Slide Structure
Two-slide layout. Each slide features a centered doughnut chart with large percentage display (70% or 50%), left or right-aligned legend (value1, value2), title area in upper section, descriptive text at bottom, and five human icons for demographic representation. Slide 1 uses green-yellow palette; Slide 2 employs blue-orange or gray-orange tones for visual variety and distinction.
Related Products
-

User Analysis Pictogram Graph – Visualizing Customer Success
#Market and Competitor Analysis #Customer Success Stories #Graph
-

Customer Feedback Breakdown by Gender – Insightful Data Visualization
#Market and Competitor Analysis #Customer Success Stories #Diagram
-

Optimized Template for Presentations – Efficient Information Delivery
#Market and Competitor Analysis #Customer Success Stories #Text Box
-

Customer Analysis Donut Chart - Visualizing Market Share
#Market and Competitor Analysis #Graph #Other
