Snow Mountain Theme Broken Line Graph – Suitable for Market and Competitive Analysis
RJ0300026_14
- Last Update 04/24/2025
- File Size 2.1MB
- # of Slides 2
- File Format PPTX
- Slide Ratio 16:9
- Color
Keywords
- #Content-Based Slides
- #Design-Based Slides
- #Market and Competitor Analysis
- #Graph
- #Competitor Analysis
- #Market Analysis
- #Line
- #Line Chart
- #16:9
- #line chart PowerPoint slide
- #market analysis presentation template
- #2-series data visualization
- #competitive analysis chart
- #trend analysis PowerPoint download
About the Product
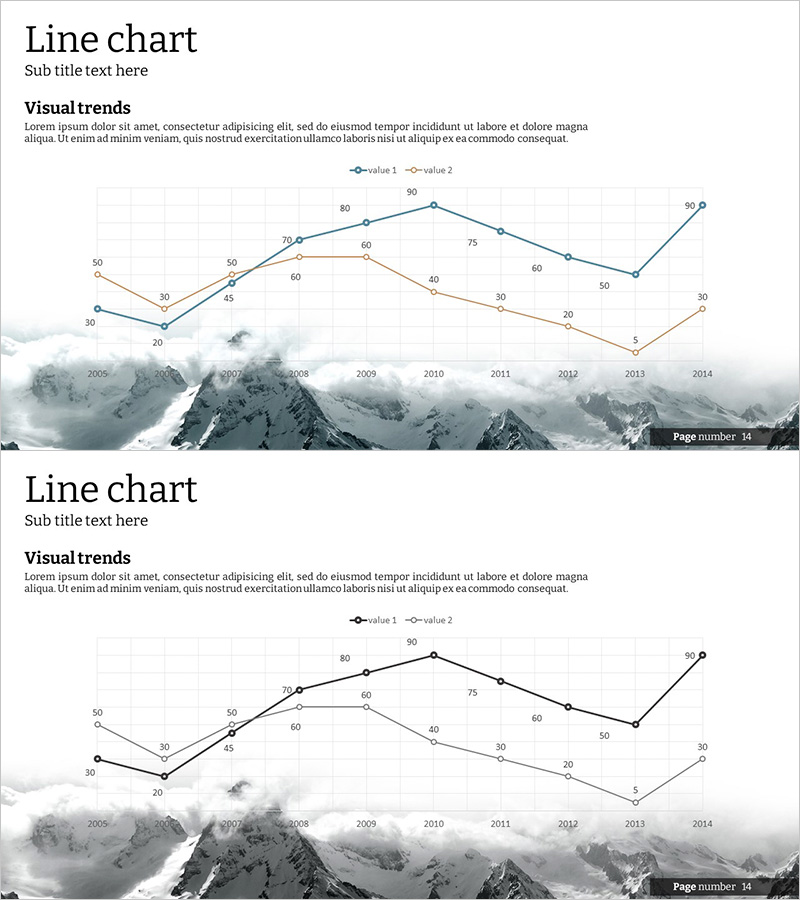
A minimalist line chart PowerPoint slide featuring a snow mountain background, designed for comparative data analysis. The slide displays two data series across a 10-year timeline (2005–2014), with each data point labeled numerically for precise trend visualization. Teal and orange colors distinguish the two series, ensuring clear differentiation and readability. The grid background facilitates accurate value interpretation, making it ideal for market analysis, competitive benchmarking, and performance reporting. This 2-slide PPTX template is ready for immediate use in presentations, reports, and analytical documents.
Usage Points
-
Main Usage
Compares two or more data series over time, ideal for visualizing market growth trajectories, competitor performance metrics, quarterly revenue trends, and customer satisfaction evolution. Enables stakeholders to identify patterns, inflection points, and comparative advantages at a glance.
-
How to Use
Replace the existing data points and numerical labels with your actual analysis data. Maintain the teal and orange color scheme or customize to match corporate branding. Edit the title, subtitle, and legend to reflect your presentation topic. The grid background aids in precise data alignment and readability.
-
Recommended For
Marketing strategists, business analysts, financial planners, and sales managers presenting market reports, competitive analyses, and performance reviews. Suitable for quarterly business reviews, annual strategic planning sessions, and investor presentations.
-
Slide Structure
2-slide layout. Each slide features a dual-series line graph with teal and orange lines representing two data sets across 10 time intervals (2005–2014). Numerical labels appear at each data point, with a legend, title, and subtitle area. Snow mountain background imagery spans the entire slide for visual consistency.
Related Products
-

Black Navy Broken Line Graph Table – Market and Competitor Analysis
#Market and Competitor Analysis #Diagram #Graph
-

Competitor Technology Comparison Graph – Market and Competitor Analysis
#Market and Competitor Analysis #Graph #Competitor Analysis
-

Space Illustration Theme Broken Line Graph
#Market and Competitor Analysis #Graph #Competitor Analysis
-

Data Analysis Graph Visualization for Market Competition
#Market and Competitor Analysis #Diagram #Graph
