Medical Development Data Analysis Graph – Market and Competitor Analysis
RJ0700012_17
- Last Update 07/25/2025
- File Size 1.6MB
- # of Slides 2
- File Format PPTX
- Slide Ratio 16:9
- Color
Keywords
About the Product
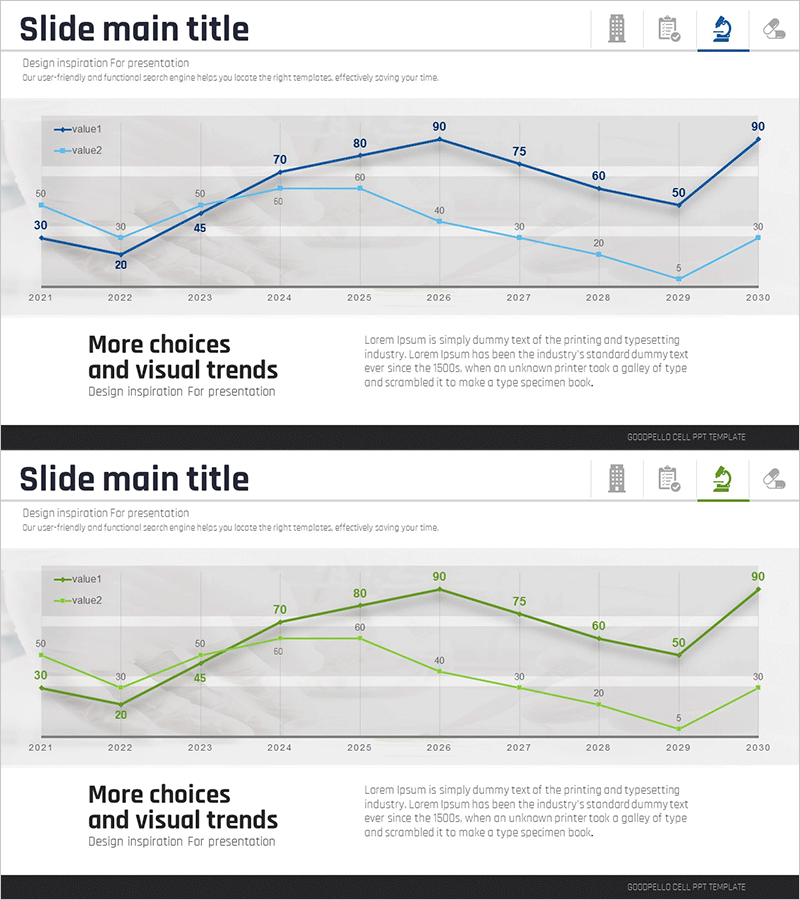
A 2-slide line chart PowerPoint template designed for medical development and market analysis presentations. The slides visualize trend data from 2021 to 2030 using two distinct series (value1 and value2) rendered in blue and light blue colors, enabling clear comparative analysis. Each slide includes a title section, legend, and data point labels for immediate use in competitor analysis, market trend reporting, and performance tracking. Delivered in 16:9 widescreen PPTX format with fully editable colors, values, and text fields for seamless customization across various business contexts.
Usage Points
-
Main Usage
Visualize numerical changes over time across two or more data series for comparative trend analysis. Ideal for presenting medical development project metrics, market size evolution, competitive growth rates, and performance indicators to support strategic decision-making in executive briefings and investor presentations.
-
How to Use
Insert into the 'Market Trends' or 'Performance Analysis' section of business reports, investor pitch decks, or quarterly reviews. Double-click the chart to edit existing values or input new data; the visualization updates automatically. Reuse across multiple reporting cycles by simply updating the underlying dataset.
-
Recommended For
Medical and pharmaceutical R&D teams reporting development progress, startups presenting market growth metrics, consulting firms conducting competitive analysis, and financial institutions preparing investment due diligence materials. Particularly suited for executive-level reporting and external investor presentations requiring quantitative evidence.
-
Slide Structure
Two identical slides with consistent layout: title area at top + central line chart (X-axis: years 2021–2030, Y-axis: values 0–100, two colored series lines) + legend in upper left (value1, value2) + descriptive text area at bottom. Data point labels displayed on each node for precise value reference.
Related Products
-

Virus Analysis Broken Line Graph – Market and Competitor Analysis
#Market and Competitor Analysis #Graph #Competitor Analysis
-

Competitor Analysis Broken Line Graph
#Market and Competitor Analysis #Graph #Competitor Analysis
-

Project Market Environment Analysis Chart – Powerful Competitive Strategy
#Market and Competitor Analysis #Graph #Competitor Analysis
-

Interior Market Analysis Graph – Insights into Market Status
#Market and Competitor Analysis #Diagram #Graph
