Line Chart & Table – Market and Competitor Analysis
RJ0300025_13
- Last Update 04/24/2025
- File Size 1MB
- # of Slides 2
- File Format PPTX
- Slide Ratio 16:9
- Color
Keywords
About the Product
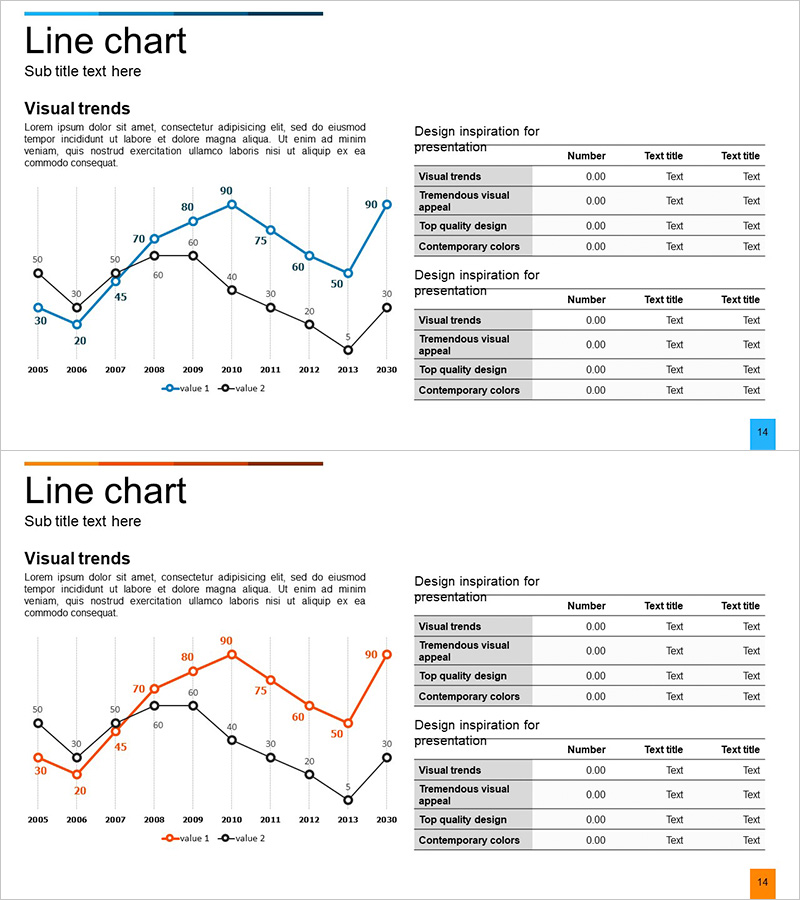
A dual-series line chart PowerPoint slide designed to compare market trends and competitor performance simultaneously. Two independent data series are visualized in blue and black, with clear numerical labels for each year. The right side features an evaluation table with categories such as 'Visual trends', 'Visual appeal', 'Design quality', and 'Color harmony', enabling integrated presentation of quantitative data and qualitative analysis. Provided as a 2-slide set in 16:9 widescreen format, fully editable in PPTX.
Usage Points
-
Main Usage
Compares market trends and competitor performance over extended periods. Two independent data series are displayed simultaneously to clearly visualize relative performance differences and change trajectories. Qualitative evaluation items presented alongside quantitative data enable integrated analysis presentation.
-
How to Use
Place in the 'Market Analysis' or 'Competitive Analysis' section of business reports, marketing plans, or investor presentations. Replace each data point with actual figures, modify the right-side table evaluation items to match your analysis, and adjust colors and fonts to align with corporate branding guidelines.
-
Recommended For
Marketing managers, business planners, executives, consultants, and investor presentations. Particularly effective for organizations handling long-term trend data such as market size changes, revenue trajectories, customer satisfaction evolution, and market share comparisons.
-
Slide Structure
Slide 1: Title area + dual-series line chart (2005-2030, blue and black distinction) + numerical labels for each data point + right-side evaluation table (4 rows × 3 columns). Slide 2: Alternative color version (orange and black series) for flexible presentation options.
Related Products
-

Market Trend Analysis Graph – Visualizing Market Status
#Market and Competitor Analysis #Diagram #Graph
-

Sales and Profit Analysis Graph – Market Trends and Forecast
#Market and Competitor Analysis #Diagram #Graph
-

Graph Chart for Analysis Comparison – Market and Competitor Analysis
#Market and Competitor Analysis #Diagram #Graph
-

Competitor Market Analysis Table – Strategic Insights
#Market and Competitor Analysis #Diagram #Graph
