Graph Chart for Analysis Comparison – Market and Competitor Analysis
RJ0300037_16
- Last Update 04/27/2025
- File Size 1MB
- # of Slides 2
- File Format PPTX
- Slide Ratio 16:9
- Color
Keywords
- #Content-Based Slides
- #Design-Based Slides
- #Market and Competitor Analysis
- #Diagram
- #Graph
- #Competitor Analysis
- #Market Analysis
- #Table
- #Line
- #Standard Table
- #Line Chart
- #16:9
- #line chart PowerPoint slide
- #trend comparison presentation
- #market analysis chart
- #competitor analysis graph
- #data visualization PPT slide
About the Product
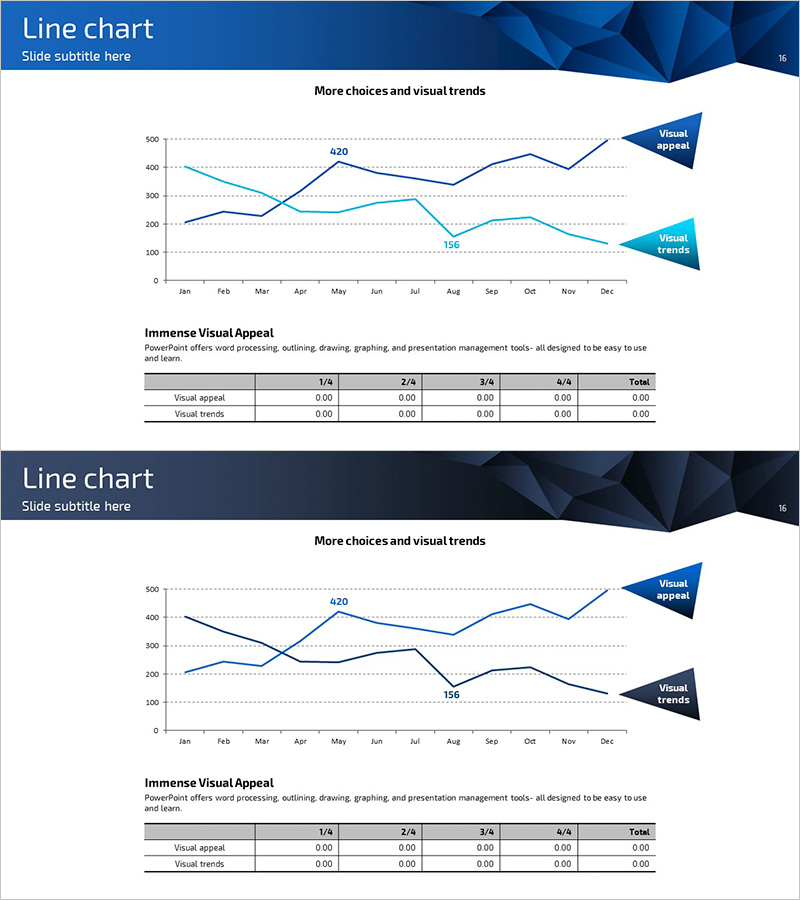
A line chart PowerPoint slide designed for market analysis and competitor analysis presentations. The dark blue geometric header and white background create strong visual contrast, making data highly readable. Two trend lines display comparative data across 12 monthly data points, with peak values highlighted (420, 156) to emphasize key metrics. A data table below the chart provides detailed numerical support, enabling comprehensive analysis. This presentation template is ready to use in business reports, analysis documents, and strategic presentations.
Usage Points
-
Main Usage
Visualize monthly or quarterly trend changes across two or more data series to illustrate market dynamics, competitor performance, or sales progression. Peak value indicators and legend enhance key metrics, while the supporting data table below reinforces credibility and enables detailed discussion.
-
How to Use
Insert into executive reports, quarterly performance presentations, market analysis briefings, and competitive strategy meetings where trend comparison is essential. Customize series colors (dark blue and light blue) to represent company vs. competitor, or actual vs. target performance.
-
Recommended For
Marketing teams conducting market analysis, sales teams presenting performance reports, executives in strategic planning meetings, investor relations for pitch decks, and consulting firms delivering data-driven recommendations.
-
Slide Structure
Two-slide set. Each slide features a dark blue geometric header (16:9 aspect ratio), central line chart with 12-month X-axis and 0–500 Y-axis range with dual trend lines, right-aligned legend (Visual appeal and Visual trends), and bottom data table with 4 quarterly columns and 2 data rows.
Related Products
-

Line Chart & Table – Market and Competitor Analysis
#Market and Competitor Analysis #Diagram #Graph
-

Competitor Market Analysis Table – Strategic Insights
#Market and Competitor Analysis #Diagram #Graph
-

Black Navy Broken Line Graph Table – Market and Competitor Analysis
#Market and Competitor Analysis #Diagram #Graph
-

Market Comparison Analysis Broken Line Graph – Competitor Analysis and Visual Impact
#Market and Competitor Analysis #Diagram #Graph
