Competitor Market Analysis Table – Strategic Insights
RJ0300060_13
- Last Update 05/04/2025
- File Size 0.9MB
- # of Slides 2
- File Format PPTX
- Slide Ratio 16:9
- Color
Keywords
- #Content-Based Slides
- #Design-Based Slides
- #Market and Competitor Analysis
- #Diagram
- #Graph
- #Competitor Analysis
- #Market Analysis
- #Table
- #Line
- #Standard Table
- #Line Chart
- #16:9
- #line chart PowerPoint
- #trend comparison slide
- #dual-series data visualization
- #competitor analysis PowerPoint
- #market analysis chart template
About the Product
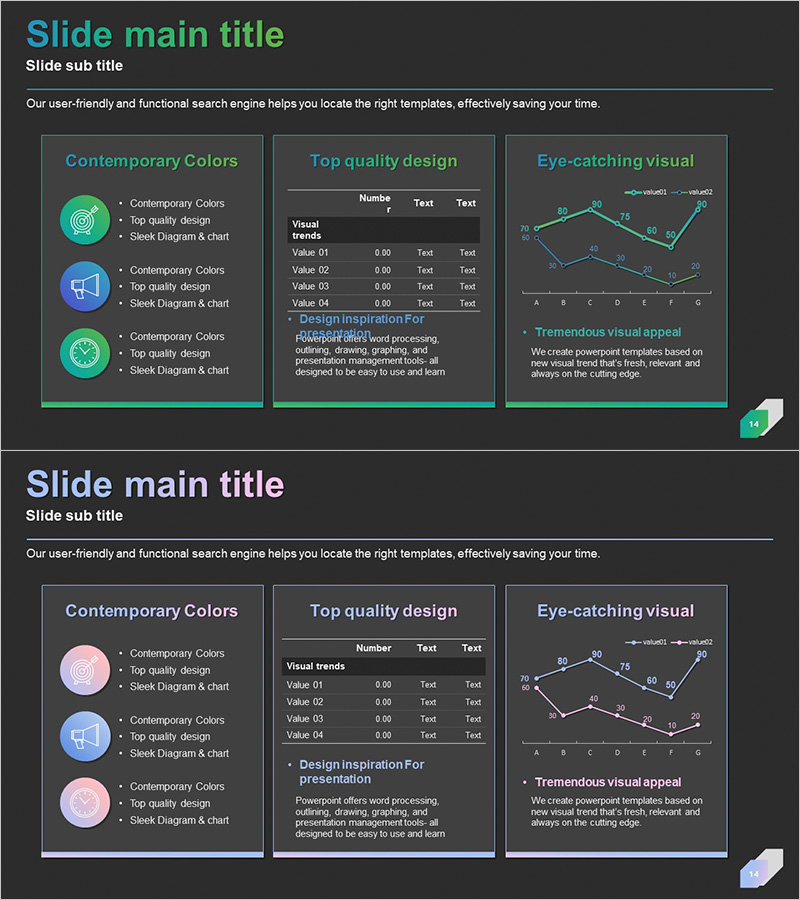
A dual-series line chart PowerPoint slide designed for competitive market analysis and trend comparison. This presentation template visualizes data changes across two data series, making it ideal for displaying market trends, revenue performance, and key performance indicators. The dark background with teal and purple accent lines creates strong visual contrast, while data points and numerical labels are clearly marked. Ready to use for strategic planning presentations, executive reports, and investor pitch decks.
Usage Points
-
Main Usage
This line chart slide enables effective visualization of competitive market analysis and trend comparison across two data series. It supports time-series data representation for metrics such as revenue, market share, and customer satisfaction. The dual-axis design allows simultaneous comparison of related performance indicators.
-
How to Use
Use this slide in executive presentations, investor pitch meetings, and strategic planning sessions to explain market conditions and competitive positioning. Simply edit the data values and legend to match your analysis results, then insert directly into your presentation. The dark background design ensures excellent readability in projector environments.
-
Recommended For
Recommended for executives, strategy teams, marketing professionals, sales leaders, and finance teams who rely on data-driven decision making. Suitable for quarterly and annual performance reports, market analysis documents, competitive strategy meetings, and investor presentations.
-
Slide Structure
Two-slide set, each featuring a dual-series line chart. The X-axis displays segments A through G, while the Y-axis shows a 0-100 numerical scale with precise data point values. Teal and purple lines distinguish the two data series, with legend and title areas clearly positioned for professional presentation.
Related Products
-

Black Navy Broken Line Graph Table – Market and Competitor Analysis
#Market and Competitor Analysis #Diagram #Graph
-

Competitive Market Analysis Graph - Insights for Understanding the Market
#Market and Competitor Analysis #Diagram #Graph
-

Target Market Trend Analysis Graph by Year – Market and Competitor Analysis
#Market and Competitor Analysis #Diagram #Graph
-

Market Comparison Analysis Broken Line Graph – Competitor Analysis and Visual Impact
#Market and Competitor Analysis #Diagram #Graph
