Analysis Graph by Car Type – Insights with Doughnut Chart
RJ0300025_11
- Last Update 04/24/2025
- File Size 0.1MB
- # of Slides 2
- File Format PPTX
- Slide Ratio 16:9
- Color
Keywords
- #Content-Based Slides
- #Design-Based Slides
- #Business Introduction
- #Market and Competitor Analysis
- #Graph
- #Technological Status
- #Market Analysis
- #Circles
- #Doughnut Chart
- #16:9
- #doughnut chart PowerPoint
- #donut graph slide template
- #3-item comparison slide
- #pie chart presentation
- #market analysis graph
- #data visualization PowerPoint
About the Product
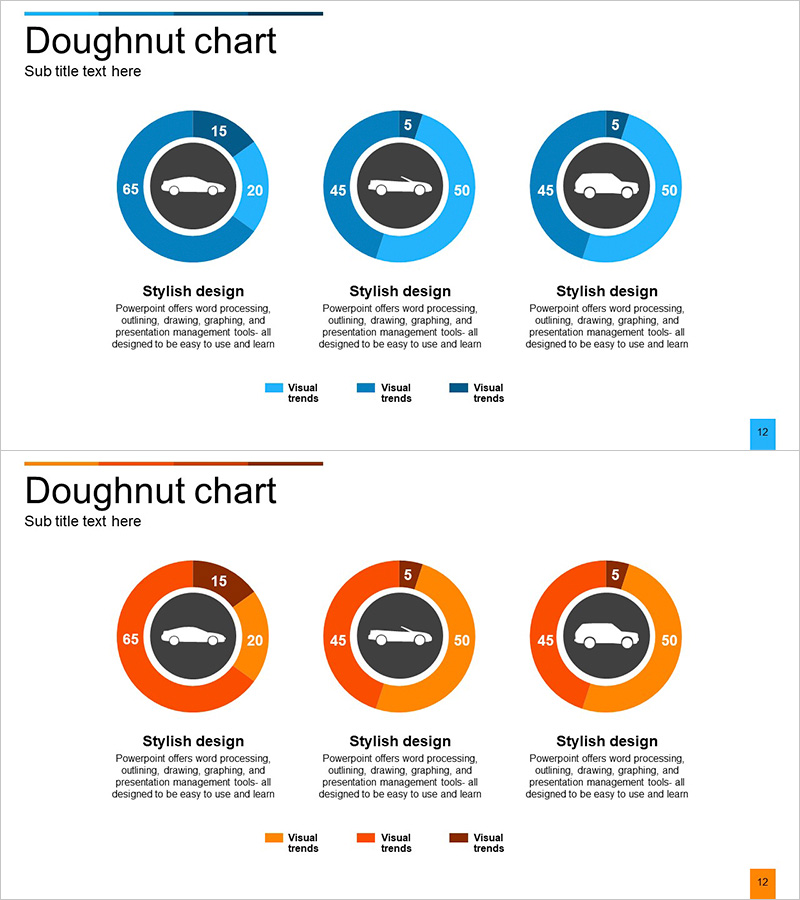
A PowerPoint slide template featuring doughnut charts for visualizing three-item comparisons such as car market analysis, sales performance, and technology benchmarking. The design places an icon in the center with numerical data displayed on the outer ring, enabling quick comprehension of proportions and trends across categories. Two color versions—blue and orange—are included in a 16:9 widescreen format with 2 slides total. This presentation slide is ready to use for market analysis, product comparison, performance reporting, and other data visualization needs.
Usage Points
-
Main Usage
Visualizes three-item comparisons—such as car market analysis, sales volume, or technology assessment—using doughnut charts. The center icon clarifies the topic while outer-ring numerals convey quantitative data in a clear, professional format.
-
How to Use
Insert into business reports, marketing plans, or market analysis documents in the data section. Customize text and figures to match your dataset, and select either the blue or orange version to align with your presentation's overall tone and branding.
-
Recommended For
Recommended for automotive and manufacturing marketing professionals, market research analysts, sales presentation creators, and executives preparing data-driven reports. Applicable across industries requiring numerical comparison and analysis.
-
Slide Structure
2-slide set. Each slide displays three doughnut charts in horizontal layout with a center icon and four data points (top, right, bottom, left) on the outer ring. Legend and descriptive text areas are positioned at the bottom of each slide.
Related Products
-

Business Idea Development Analysis Circle Graph
#Business Introduction #Market and Competitor Analysis #Diagram
-

Big Data Comprehensive Analysis Chart – Insights for Market Analysis
#Business Introduction #Market and Competitor Analysis #Diagram
-

Trend Color Donut Chart – Innovating Data Analysis
#Business Introduction #Market and Competitor Analysis #Graph
-

Service Technology Analysis Circle Graph – Market Analysis and Technology Status
#Business Introduction #Market and Competitor Analysis #Diagram
