Big Data Comprehensive Analysis Chart – Insights for Market Analysis
RM0200006_17
- Last Update 02/02/2025
- File Size 1MB
- # of Slides 2
- File Format PPTX
- Slide Ratio 16:9
- Color
Keywords
- #Content-Based Slides
- #Design-Based Slides
- #Business Introduction
- #Market and Competitor Analysis
- #Diagram
- #Graph
- #Technological Status
- #Market Analysis
- #Table
- #Circles
- #Doughnut Chart
- #16:9
- #donut chart PowerPoint slide
- #pie chart template
- #market analysis visualization
- #big data PowerPoint
- #4-segment ratio chart
About the Product
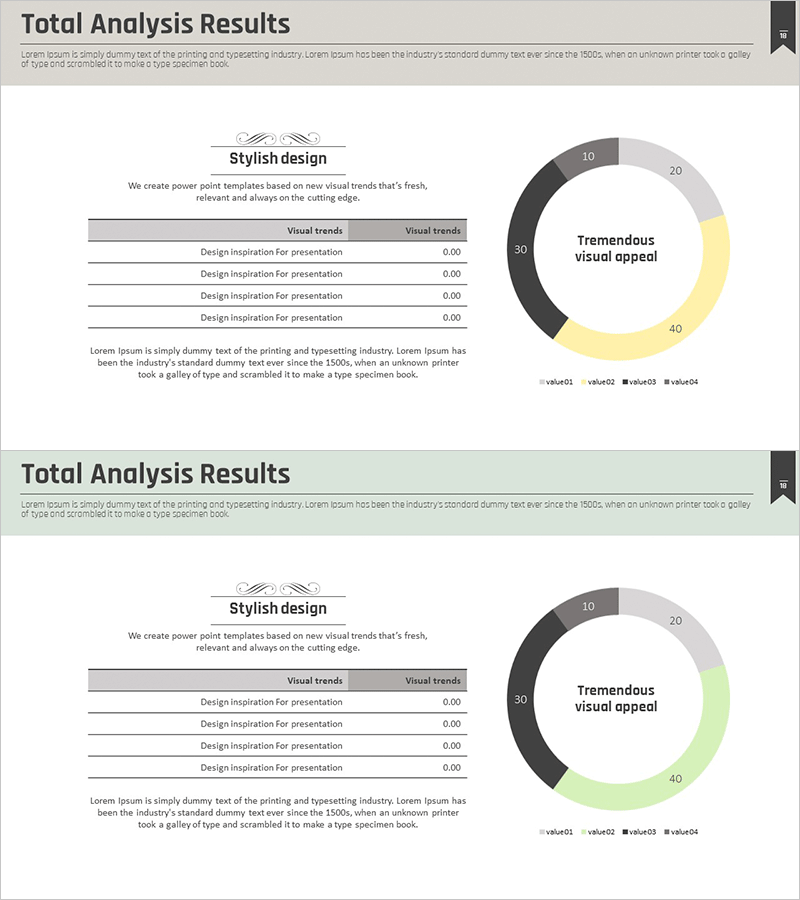
A professional donut chart PowerPoint slide designed to present big data analysis results with clarity and impact. The circular chart features four distinct segments in dark gray, light gray, yellow, and lime green, making it ideal for visualizing market share, customer segmentation, revenue distribution, and other proportional data. This 2-slide template is fully editable—simply update the values and labels to match your analysis. The 16:9 widescreen format ensures compatibility with modern presentation environments and displays.
Usage Points
-
Main Usage
Effectively communicate market share, customer demographics, revenue breakdown, and product category proportions. The hollow center of the donut provides space to highlight key metrics or titles, drawing viewer attention to the most critical data points.
-
How to Use
Integrate into executive reports, market analysis presentations, investor pitch decks, and business plan financial sections. Double-click any chart element to edit values, labels, and colors directly within PowerPoint, allowing you to input real-time data without redesigning the layout.
-
Recommended For
Data analysts, marketing professionals, executives, management consultants, and financial analysts who need to present quantitative insights. Ideal for any business presentation requiring proportion comparison and compositional analysis across industries and departments.
-
Slide Structure
2-slide template featuring a 4-segment donut chart (dark gray 30%, light gray 20%, yellow 40%, lime green 10%) with legend on the first slide, and the same chart with additional explanation text area on the second. 16:9 widescreen format in PPTX, compatible with all PowerPoint versions.
Related Products
-

Service Technology Analysis Circle Graph – Market Analysis and Technology Status
#Business Introduction #Market and Competitor Analysis #Diagram
-

Business Status Chart – Presentation Template for Market Analysis
#Market and Competitor Analysis #Diagram #Graph
-

Drug Addiction Risk Analysis Graph Chart – Insightful Information Delivery
#Market and Competitor Analysis #Diagram #Graph
-

Detailed Analysis of Shareholder Status Donut Chart
#Company Introduction #Market and Competitor Analysis #Diagram
