Trend Color Donut Chart – Innovating Data Analysis
RJ0200045_6
- Last Update 04/11/2025
- File Size 0.9MB
- # of Slides 2
- File Format PPTX
- Slide Ratio 16:9
- Color
Keywords
- #Content-Based Slides
- #Design-Based Slides
- #Business Introduction
- #Market and Competitor Analysis
- #Graph
- #Technological Status
- #Market Analysis
- #Circles
- #Doughnut Chart
- #16:9
- #donut chart PowerPoint
- #pie chart slide template
- #data visualization presentation
- #how to create donut chart in PowerPoint
- #ratio data slide download
About the Product
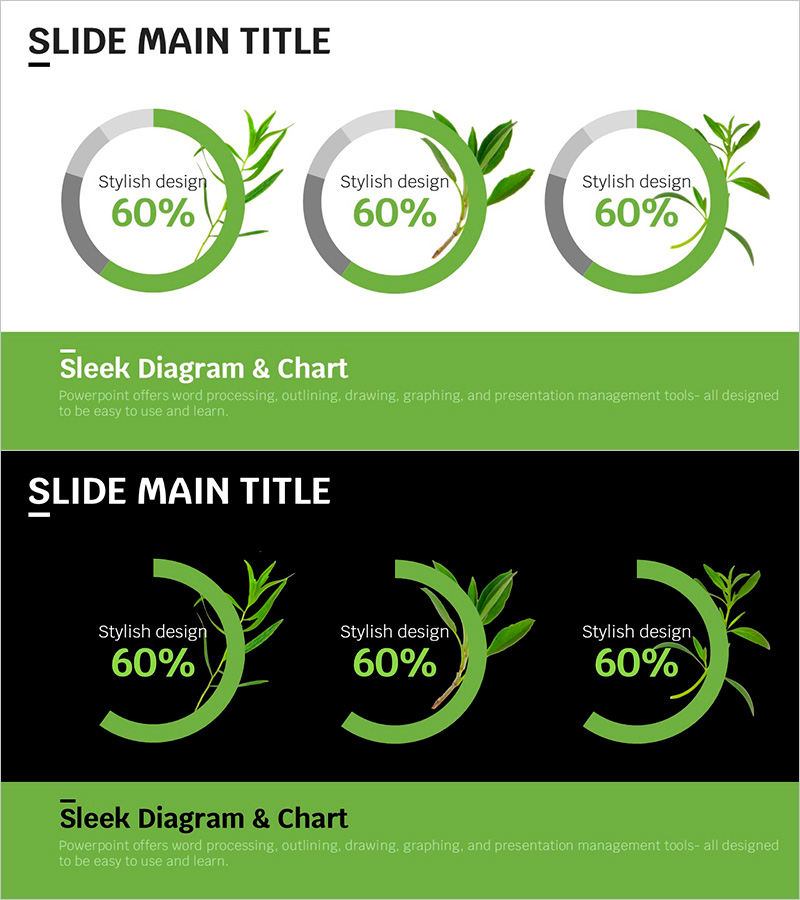
A donut chart PowerPoint slide optimized for ratio representation and data composition analysis. The harmonious combination of green and gray tones creates a professional appearance for business presentations. Each segment displays percentage values clearly, making it ideal for visualizing market share, technology stack composition, business unit breakdown, and customer segmentation. The 2-slide template includes both light and dark background versions for flexible integration into any presentation theme. Fully editable and ready to customize with your own data.
Usage Points
-
Main Usage
This donut chart emphasizes proportional relationships in circular data visualization. Perfect for displaying market share distribution, technology stack composition, business unit percentages, and customer segmentation. The hollow center allows you to add key metrics or titles, enhancing information hierarchy and visual impact.
-
How to Use
Use this slide in business introductions, market analysis presentations, and technology overview sections to represent compositional data. Replace the percentage values with your actual data, and add legends or descriptive labels as needed. Choose between the light or dark background version depending on your presentation theme and color scheme.
-
Recommended For
Marketing professionals, business strategists, data analysts, and finance teams presenting ratio-based information. Ideal for investor pitch decks, quarterly business reports, market research presentations, technology stack introductions, and departmental performance reviews.
-
Slide Structure
Two-slide template featuring a 3-segment donut chart design. Each segment uses distinct green tones with a gray background ring for structural emphasis. Percentage labels (60% format) and descriptive text appear beside each segment, with green botanical illustrations as decorative accents on both light and dark background layouts.
Related Products
-

Service Technology Analysis Circle Graph – Market Analysis and Technology Status
#Business Introduction #Market and Competitor Analysis #Diagram
-

Business Idea Development Analysis Circle Graph
#Business Introduction #Market and Competitor Analysis #Diagram
-

Big Data Comprehensive Analysis Chart – Insights for Market Analysis
#Business Introduction #Market and Competitor Analysis #Diagram
-

Analysis Graph by Car Type – Insights with Doughnut Chart
#Business Introduction #Market and Competitor Analysis #Graph
