Competitor Analysis Broken Line Graph - Visualizing Market Trends
RJ0300024_8
- Last Update 04/24/2025
- File Size 0.4MB
- # of Slides 2
- File Format PPTX
- Slide Ratio 16:9
- Color
Keywords
About the Product
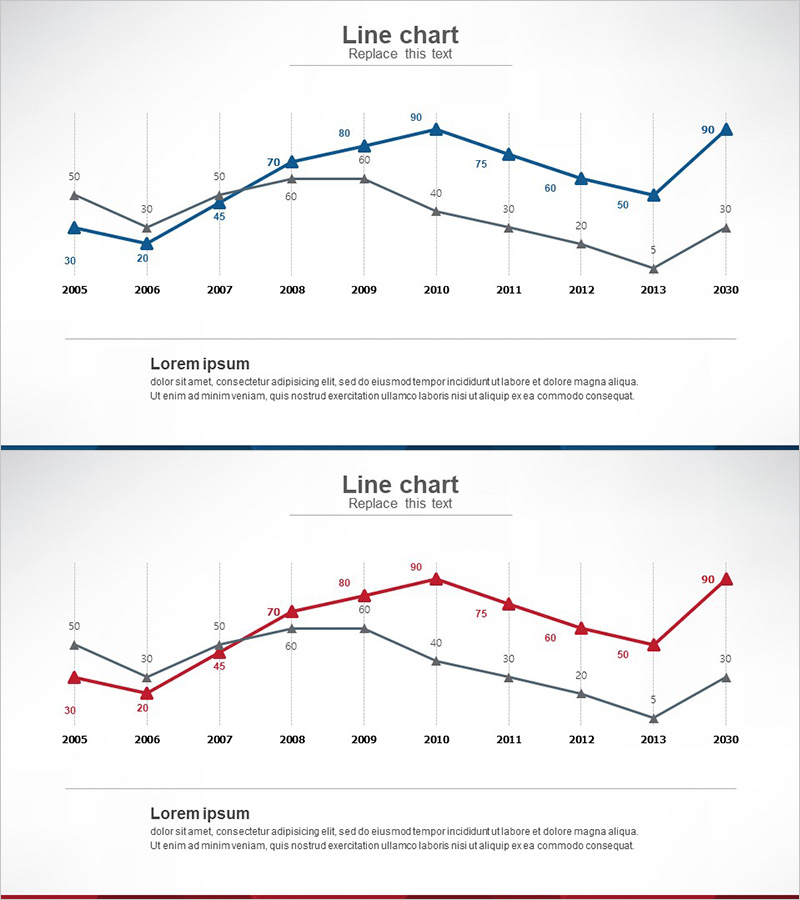
A multi-series line chart PowerPoint slide designed for competitor analysis and market visualization. This presentation template displays 25-year trend data (2005-2030) across three distinct data series, with numerical values marked at each data point for precise information delivery. Color-coded series in blue, gray, and red ensure clear differentiation, while grid background facilitates accurate value reading. Ideal for business reports, marketing strategy presentations, investor pitch decks, and quarterly performance reviews. Fully editable PPTX format with 16:9 aspect ratio for modern displays.
Usage Points
-
Main Usage
Visualize long-term market trends, compare competitor performance metrics, and illustrate business growth trajectories. The three-series format enables simultaneous comparison of multiple KPIs, while labeled data points ensure precise numerical communication to stakeholders.
-
How to Use
Insert into market analysis sections of business reports, competitive landscape slides in marketing decks, or performance trend charts in investor presentations. Replace axis labels, series names, and data values with your own metrics. Customize colors and legend as needed for brand consistency.
-
Recommended For
Executive presentations, quarterly business reviews, investor relations materials, competitive intelligence reports, market research summaries, financial performance dashboards, and strategic planning sessions for C-suite, marketing directors, and business analysts.
-
Slide Structure
Two-slide template offering dual color schemes. Slide 1 features blue, gray, and black series; Slide 2 presents red, gray, and black series for design flexibility. Both slides include Y-axis range (0-50), X-axis timeline (2005-2030), gridlines for reference, and labeled data points with numerical values at each intersection.
Related Products
-

Gradient Line Graph – Market and Competitor Analysis
#Market and Competitor Analysis #Graph #Competitor Analysis
-

Competitor Technology Comparison Graph – Market and Competitor Analysis
#Market and Competitor Analysis #Graph #Competitor Analysis
-

Medical Experimental Research Data Analysis Slide – Market and Competitor Analysis
#Market and Competitor Analysis #Graph #Competitor Analysis
-

Medical Development Data Analysis Graph – Market and Competitor Analysis
#Market and Competitor Analysis #Graph #Competitor Analysis
