Graph Showing Trend of Confirmed COVID-19 Cases – Market Analysis
RJ0700023_16
- Last Update 07/28/2025
- File Size 0.4MB
- # of Slides 2
- File Format PPTX
- Slide Ratio 16:9
- Color
Keywords
About the Product
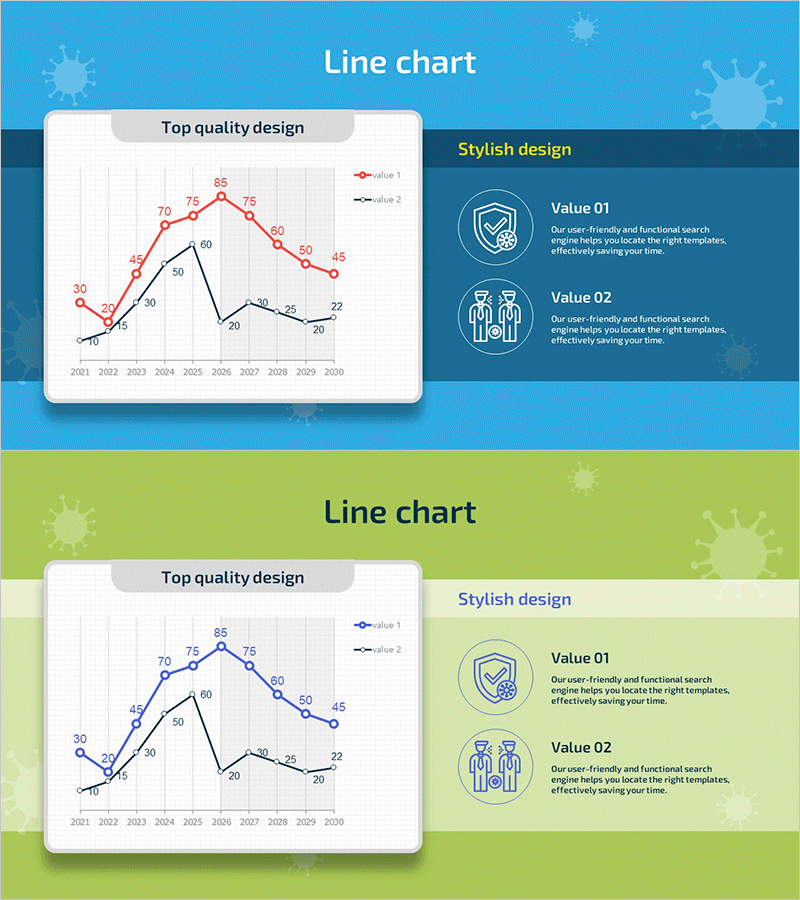
A PowerPoint line chart slide that visualizes changes in two data series over a 10-year period from 2021 to 2030. The chart uses red and black line colors to distinguish between the two datasets, with numeric values displayed at each data point for precise comparison. The layout features a chart area on the left and an icon-based explanation section on the right, presented in two color variants: blue background and green background. This slide deck is ready to use for market analysis presentations, sales trend reports, performance reviews, and any business presentation requiring trend visualization and data-driven insights.
Usage Points
-
Main Usage
Designed to compare and analyze changes in two or more data series over time. Effectively visualizes sales volume, customer count, market share, and performance metrics, with precise numeric values at each point ensuring credible reporting and data-driven decision making.
-
How to Use
Replace the chart data points and numeric values with your actual data, and update the right-side icon explanation text to match your presentation context. You can switch between blue and green background versions and adjust line colors to align with your corporate branding.
-
Recommended For
Executive reports, quarterly and annual performance presentations, market analysis materials, competitive analysis, sales performance reviews, customer growth trend explanations, and investor pitch decks. Ideal for management, marketing, and sales teams presenting long-term trend changes and strategic insights.
-
Slide Structure
Each slide contains a 2-series line chart (2021–2030 data with numeric values at each point) plus a right-side icon-based explanation area with 2 key points. Includes one blue-background version and one green-background version (2 slides total) in 16:9 widescreen PPTX format.
Related Products
-

Competitor Technology Comparison Graph – Market and Competitor Analysis
#Market and Competitor Analysis #Graph #Competitor Analysis
-

Project Market Environment Analysis Chart – Powerful Competitive Strategy
#Market and Competitor Analysis #Graph #Competitor Analysis
-

Competitor Analysis Broken Line Graph
#Market and Competitor Analysis #Graph #Competitor Analysis
-

Competitor Analysis Broken Line Graph – Market Insights Provided
#Market and Competitor Analysis #Graph #Competitor Analysis
