Progress Status Pie Chart by Task – Effective Data Visualization
RJ0300024_14
- Last Update 04/24/2025
- File Size 0.3MB
- # of Slides 2
- File Format PPTX
- Slide Ratio 16:9
- Color
Keywords
About the Product
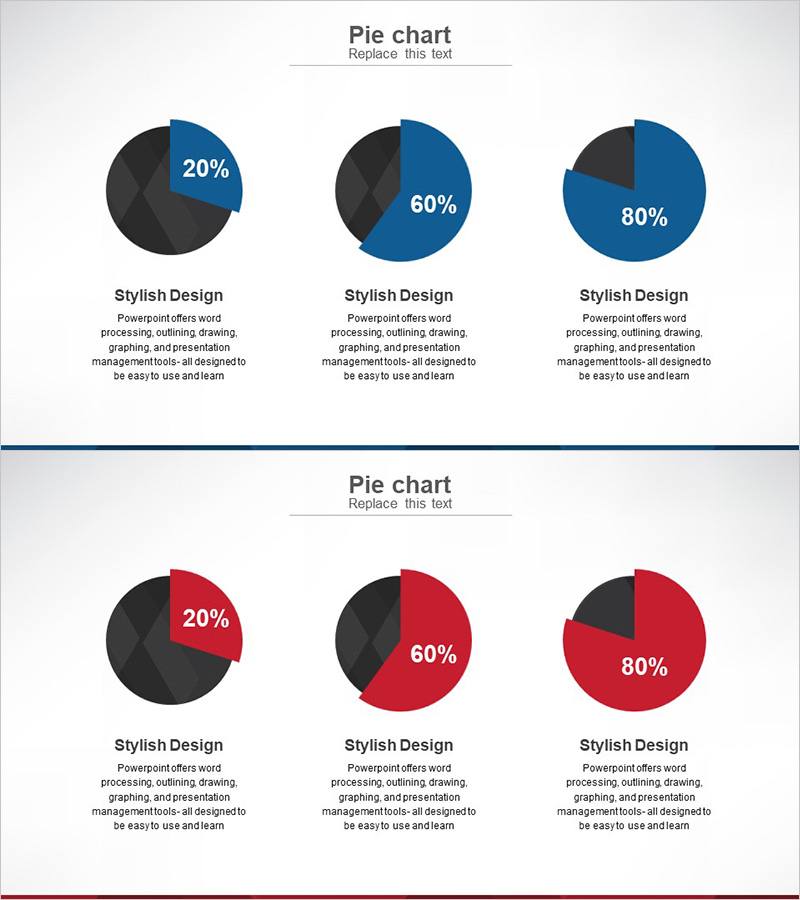
This free PowerPoint slide features three pie charts arranged side by side in a clean three-column horizontal layout, available in two color versions: blue-and-dark and red-and-dark. Each chart displays a bold percentage value at the center, with a title and description text area below for labeling each data point. The light gray background provides strong contrast against both color schemes, making the data easy to read at a glance. This presentation slide is ideal for visualizing task progress, market share, development completion rates, or goal achievement percentages across three comparable categories. Simply replace the percentage values, titles, and description text to adapt the slide to your own data—no advanced design skills required. The PPTX file is fully editable in PowerPoint, and the slide can be inserted into any business report, marketing plan, or pitch deck. For a wider variety of graph slides, explore GoodPello's premium graph slide collection.
Usage Points
-
Main Usage
Designed to compare three ratio or percentage data points side by side using pie charts. Two color versions—blue-and-dark and red-and-dark—are included so you can match the slide to your brand or presentation theme.
-
How to Use
Replace the percentage values on each pie chart with your actual data, then fill in the title and description text fields below each chart. Choose the blue or red color version that best fits your presentation style and insert the slide into your existing deck.
-
Recommended For
Ideal for business analysts, marketers, consultants, and project managers who need to present ratio or progress data visually. Well-suited for investor reports, marketing plans, and executive briefings where clear data comparison is essential.
-
Slide Structure
Single-slide layout with three pie charts arranged in a horizontal three-column grid. Includes two color variants (blue-and-dark, red-and-dark) on one slide. Each chart has one title field and one description text field below, providing six editable text areas in total.
Related Products
-

Vertical Bar Chart for Data Analysis – Business Insights
#Free Graphs
-

Vertical Bar Chart Visualizing Candidate Values – Trends and Choices
#Free Graphs
-

Comparative Analysis Bar Graph – Market and Competitor Analysis
#Free Graphs
-

Competitive Advantage Analysis Bar Chart – Data Visualization
#Free Graphs
