Triangular Shaped Graph for Market Share Analysis – Intuitive Data Communication
RJ0300024_10
- Last Update 04/24/2025
- File Size 0.2MB
- # of Slides 2
- File Format PPTX
- Slide Ratio 16:9
- Color
Keywords
About the Product
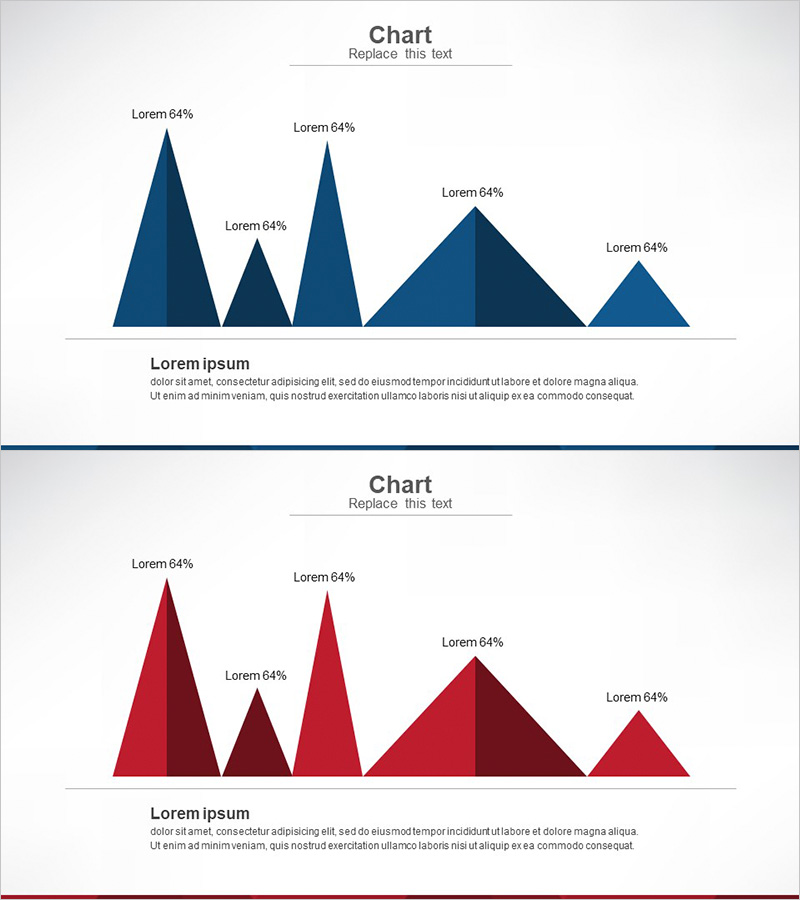
This free PowerPoint slide features six mountain-shaped triangles arranged horizontally, visualizing each item's value through the height of the triangle for intuitive comparison. The file includes two color versions—navy blue and dark red (burgundy)—so you can choose the one that best fits your presentation style. Each triangle has a label and percentage text area at the top, with a title and description section at the bottom. The triangles feature a shading effect that adds a three-dimensional appearance to the chart. This slide is ideal for presentations that require clear data communication, such as market share comparisons, competitor analysis, and revenue breakdowns. Compatible with PowerPoint in PPTX format, all text elements can be freely edited. For more free graph and chart slides, visit the GoodPello Free Graph section.
Usage Points
-
Main Usage
Visualizes up to six data items by representing their values as triangle heights, making it easy to compare market share, competitor figures, or revenue proportions at a glance in any business presentation.
-
How to Use
Select either the navy blue or burgundy color version to match your presentation theme, then replace the label and percentage text above each triangle with your actual data, and update the title and description at the bottom.
-
Recommended For
Ideal for marketers, strategy planners, and startup teams who need to present comparative data visually, as well as professionals preparing business plans, market analysis reports, or competitive landscape slides.
-
Slide Structure
Single-slide layout with six triangles of varying heights arranged left to right, six label and value text areas above each triangle, and one title plus description text block at the bottom. Includes both navy and burgundy color versions.


