Competitor Analysis Graphs & Tables – Delivering Market Insights
RJ0300023_16
- Last Update 04/23/2025
- File Size 0.4MB
- # of Slides 2
- File Format PPTX
- Slide Ratio 16:9
- Color
Keywords
- #Content-Based Slides
- #Design-Based Slides
- #Market and Competitor Analysis
- #Diagram
- #Graph
- #Competitor Analysis
- #Market Analysis
- #Table
- #Other
- #Standard Table
- #Area Chart
- #16:9
- #area chart PowerPoint slide
- #dual series trend comparison
- #competitor analysis chart
- #market analysis graph
- #data visualization PowerPoint template
- #how to create area chart in PowerPoint
About the Product
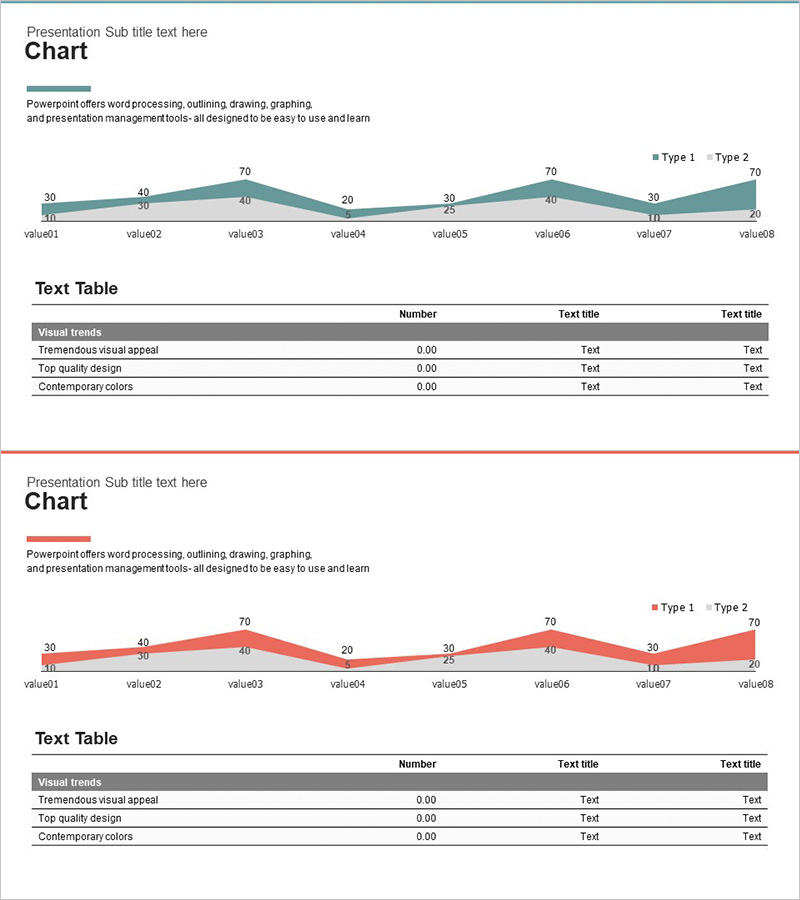
A comprehensive PowerPoint slide set for competitive analysis and market insights using area charts with dual data series. This presentation template features 8 data points visualized across 2 series in an area chart format, paired with a structured data table for detailed metrics. Two color variations are included: teal-green and coral-red, each providing distinct visual emphasis for different presentation contexts. The slides are formatted in 16:9 widescreen PPTX, fully editable and ready for immediate use in marketing reports, business analysis presentations, executive dashboards, and strategic planning sessions.
Usage Points
-
Main Usage
Ideal for visualizing multi-series data over time, including competitive analysis, market trend tracking, and performance metrics. Area charts effectively display cumulative trends while highlighting individual series changes, making them perfect for market share evolution, sales volume progression, and customer satisfaction trends.
-
How to Use
Slide 1 features a teal-green area chart comparing Type 1 and Type 2 across 8 data points. Slide 2 provides the same structure in coral-red color scheme. Each slide includes a data table below the chart with numerical values. Double-click chart elements to edit data values and customize colors directly within PowerPoint.
-
Recommended For
Marketing professionals, executives, business analysts, and consultants presenting competitive landscape analysis, market reports, quarterly performance reviews, and investor presentations. Particularly effective for strategy meetings and board reports requiring multi-variable trend comparison.
-
Slide Structure
2-slide set. Each slide contains a title section at top, a central area chart with 8 X-axis values (value01–value08) and 2 Y-axis series (Type 1, Type 2), and a bottom data table with 4 rows × 3 columns including Visual trends, Tremendous visual appeal, Top quality design, and Contemporary colors metrics.
Related Products
-

Gradient Theme Area Diagram – Market and Competitor Analysis
#Market and Competitor Analysis #Diagram #Graph
-

Market Analysis Slide Using Donut Charts and Table
#Market and Competitor Analysis #Diagram #Graph
-

Sales and Profit Analysis Graph – Market Trends and Forecast
#Market and Competitor Analysis #Diagram #Graph
-

Competitor Analysis Graph – Quickly Convey Market Share
#Market and Competitor Analysis #Diagram #Competitor Analysis
