Competitor Analysis Checklist Table – Effective Market Analysis Tool
RM0100019_12
- Last Update 01/31/2025
- File Size 0.9MB
- # of Slides 2
- File Format PPTX
- Slide Ratio 16:9
- Color
Keywords
- #Content-Based Slides
- #Design-Based Slides
- #Market and Competitor Analysis
- #Diagram
- #Competitor Analysis
- #Market Analysis
- #Table
- #Standard Table
- #16:9
- #competitor analysis table
- #comparison table PowerPoint slide
- #market analysis presentation
- #business comparison template
- #competitive analysis checklist
About the Product
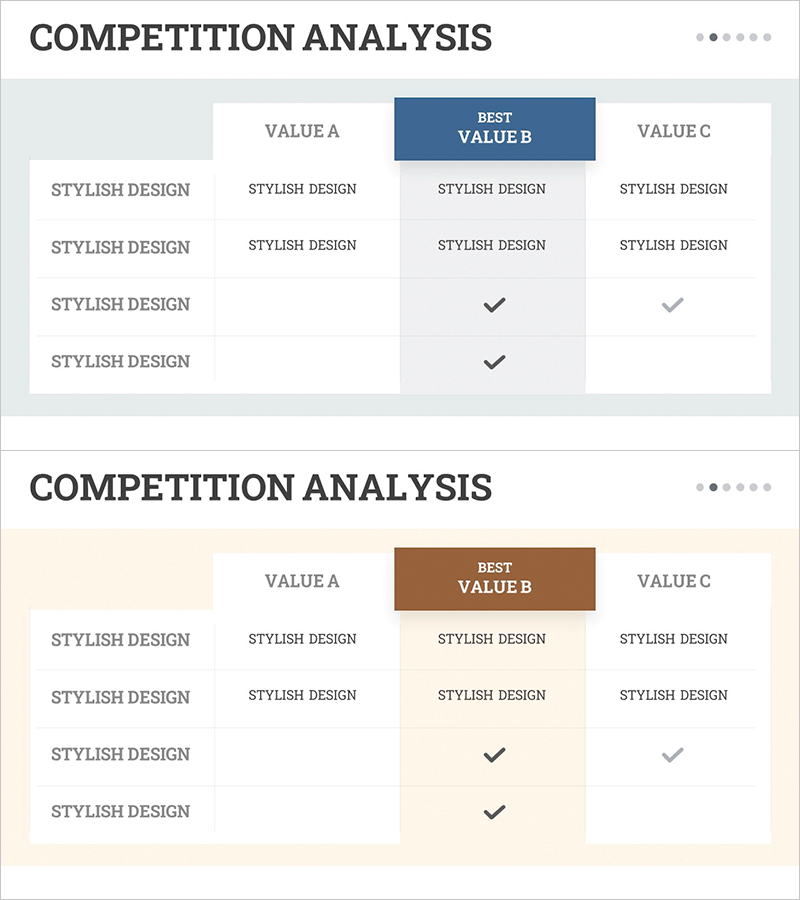
A three-column comparison table PowerPoint slide designed for competitive analysis presentations. The slide features a gray header row with VALUE A, BEST VALUE B, and VALUE C labels, and a white data area with checkmark symbols. The center column is highlighted with a dark blue background to emphasize the best-value item, creating visual contrast that draws attention to your competitive advantage. Each row contains stylish design elements and check marks for clear comparison. This slide template is ready to use for market analysis, product comparison, service evaluation, and competitive positioning in business presentations.
Usage Points
-
Main Usage
Compare three competitors, products, or services side-by-side while emphasizing your strongest competitive advantage through the highlighted center column. This slide effectively communicates market positioning and competitive differentiation in business strategy presentations.
-
How to Use
Replace VALUE A, BEST VALUE B, and VALUE C with actual competitor names or product names. Modify row labels to match your comparison criteria and adjust checkmark positions to reflect your competitive analysis results. The blue center column can be customized to highlight your company's key strengths.
-
Recommended For
Marketing managers, strategy planners, and business executives presenting competitive analysis to investors, board members, or stakeholders. Ideal for new product launch presentations, market entry strategy discussions, and competitive positioning reports.
-
Slide Structure
Three-column by four-row table layout with a gray header row containing VALUE A, BEST VALUE B, and VALUE C labels. The center column features a dark blue background for emphasis, while data rows contain item labels and checkmark symbols (✓) positioned to indicate competitive advantages.
Related Products
-

Sugar Content Analysis Bar Graph Table
#Market and Competitor Analysis #Diagram #Graph
-

Comparative Analysis Bar Graph & Table – Optimized for Market and Competitor Analysis
#Market and Competitor Analysis #Diagram #Graph
-

Market Analysis Segmented Bar Graph & Table Chart – Visualization of Competitive Analysis
#Market and Competitor Analysis #Diagram #Graph
-

Baby Products Business Competitor Table – Market and Competitor Analysis
#Market and Competitor Analysis #Diagram #Competitor Analysis
