Customer Analysis by Points – Utilizing Donut Charts
RJ0300021_9
- Last Update 04/23/2025
- File Size 6.1MB
- # of Slides 2
- File Format PPTX
- Slide Ratio 16:9
- Color
Keywords
About the Product
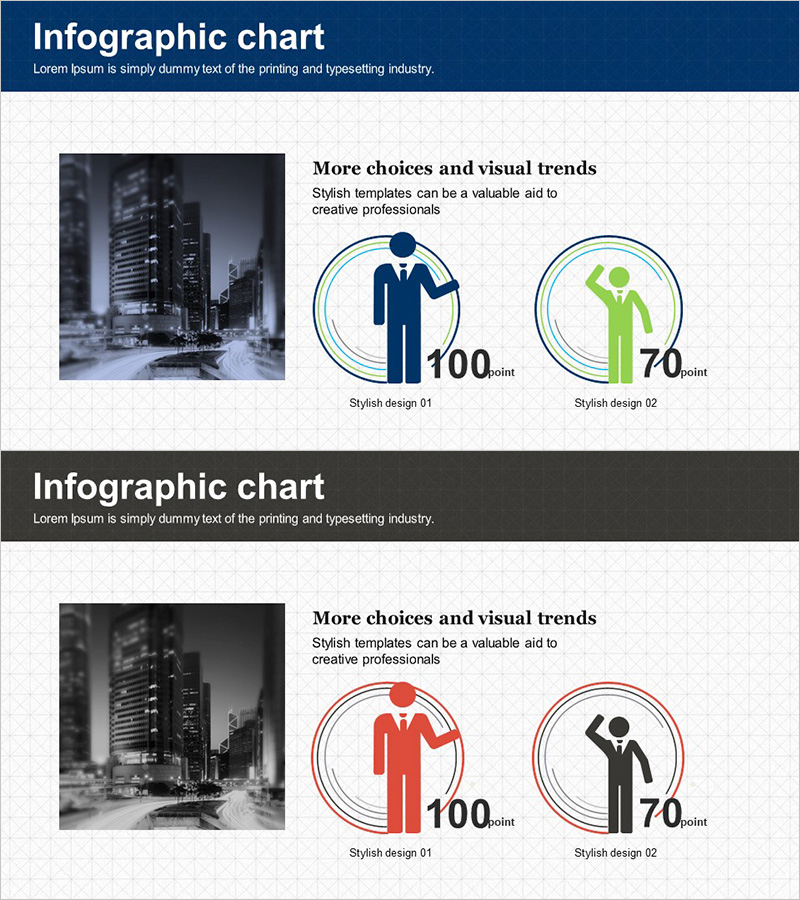
A 2-slide PowerPoint presentation featuring donut charts for customer analysis data visualization. The slides incorporate navy, lime green, and red color schemes to represent customer point distribution and segment ratios. Each slide combines urban background imagery with business-appropriate layouts, integrating text descriptions and numerical data for clear message delivery during presentations. The 16:9 widescreen PPTX format allows immediate editing and customization for your specific data and branding requirements.
Usage Points
-
Main Usage
Effectively visualize customer segment distribution, market share percentages, and customer group ratios using donut chart graphics. The labeled sections and numerical data enable presenters to communicate customer analysis findings clearly to audiences during business presentations.
-
How to Use
Deploy in business presentations, marketing strategy meetings, customer analysis reports, and sales pitches to explain customer composition and segment distribution. Edit chart sections, values, and labels directly within PowerPoint, and adjust colors to align with corporate branding guidelines.
-
Recommended For
Marketing teams, sales departments, executives, management consultants, and data analysts who base decisions on customer insights. Ideal for quarterly or annual customer analysis reporting to stakeholders and senior leadership.
-
Slide Structure
2-slide deck. Slide 1: Urban background image + title area + 2 donut charts (2-3 segments each). Slide 2: Dark background + title area + 2 donut charts (alternate color palette). Each donut chart features a central circular area and outer ring structure representing proportions, with icons and numerical labels positioned for clarity.
Related Products
-

Visualize Market and Customer Analysis with Vertical Bar Cluster Graph
#Market and Competitor Analysis #Graph #Customer Analysis
-

Internet of Things User Analysis Status – Customer Insights and Data Visualization
#Product/Service Introduction #Market and Competitor Analysis #Graph
-

Customer Ratio Analysis Slide – Delivering Market Competitiveness
#Market and Competitor Analysis #Graph #Customer Analysis
-

Silhouette Diagram & Circle Donut Graph – Visual Tool for Customer Analysis
#Product/Service Introduction #Market and Competitor Analysis #Graph
