Visualize Market and Customer Analysis with Vertical Bar Cluster Graph
RJ0300055_5
- Last Update 05/03/2025
- File Size 3MB
- # of Slides 2
- File Format PPTX
- Slide Ratio 16:9
- Color
Keywords
About the Product
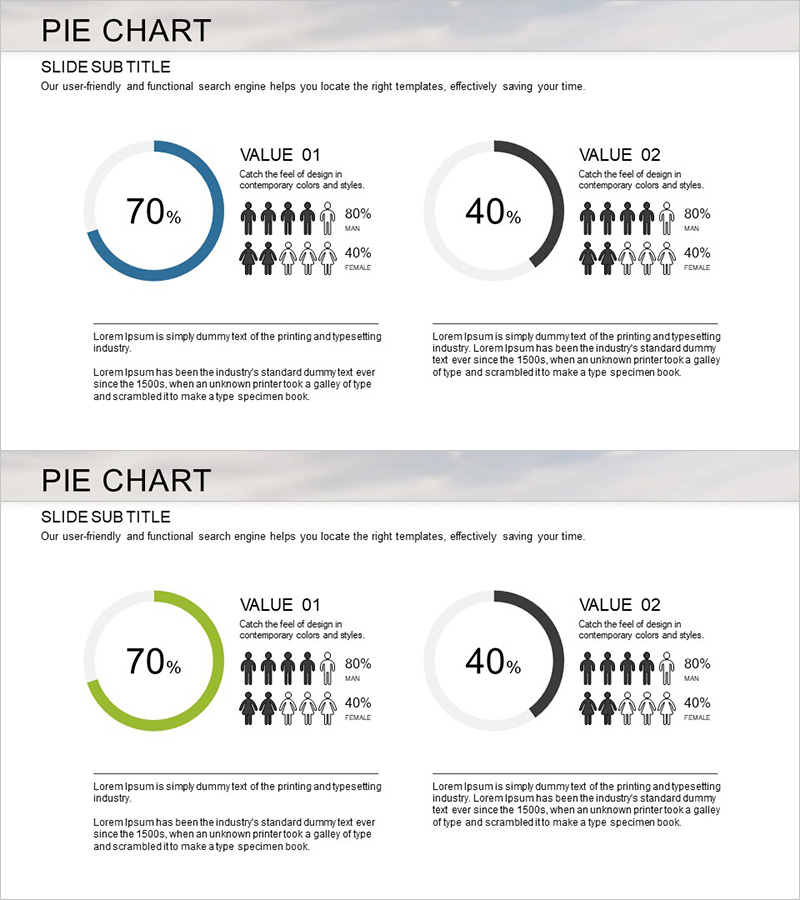
A PowerPoint slide template featuring donut charts for visualizing market and customer analysis data. The 2-slide set displays two donut-shaped pie charts per slide, enabling side-by-side comparison of two metrics. Clear color differentiation using navy blue and charcoal gray creates intuitive data hierarchy, while demographic icons positioned beside each chart allow representation of gender ratio or population segment information. Delivered in 16:9 widescreen PPTX format with full editability. Ideal for marketing reports, business analysis presentations, customer segmentation decks, and quarterly performance reviews.
Usage Points
-
Main Usage
Compare two metrics simultaneously—market size, customer composition, gender distribution, product preference—using donut-shaped pie charts. Each chart clearly represents part-to-whole ratios, while demographic icons convey additional population statistics and segment breakdown.
-
How to Use
Deploy in market analysis sections of marketing reports, customer analysis pages of business plans, and customer segmentation portions of quarterly performance reports. Replace chart percentages with your own data, edit legends and descriptive text, and customize color accents to match your brand guidelines or presentation theme.
-
Recommended For
Marketing professionals, business analysts, sales managers, management consultants, and strategic planners who rely on data-driven decision-making. Particularly effective for explaining customer segmentation, market share analysis, product-line sales ratios, regional revenue composition, and demographic breakdowns.
-
Slide Structure
2-slide layout with two donut charts per slide positioned side-by-side (VALUE 01 and VALUE 02). Each chart displays percentage values (70%, 40%) centered within the donut ring. Demographic icons (male/female silhouettes) positioned to the right of each chart with corresponding percentages (MALE 80%, FEMALE 40%). Descriptive text area at bottom of each slide for context and insights.
Related Products
-

Gender Ratio Customer Analysis Pie Chart – Emphasizing Customer Insights
#Market and Competitor Analysis #Graph #Other
-

Market Share Donut Pie Chart & Silhouette – Unique Design and Information Delivery
#Market and Competitor Analysis #Graph #Other
-

Customer Analysis and Market Share Graph – Harmony of Blue and Red
#Market and Competitor Analysis #Graph #Other
-

Silhouette Diagram & Circle Donut Graph – Visual Tool for Customer Analysis
#Product/Service Introduction #Market and Competitor Analysis #Graph
