Customer Share Pie Chart – Attractive Customer Analysis
RJ0500009_15
- Last Update 06/09/2025
- File Size 0.3MB
- # of Slides 2
- File Format PPTX
- Slide Ratio 16:9
- Color
Keywords
- #Content-Based Slides
- #Design-Based Slides
- #Product/Service Introduction
- #Market and Competitor Analysis
- #Graph
- #Development Status
- #Customer Analysis
- #Circles
- #Doughnut Chart
- #16:9
- #doughnut chart PowerPoint slide
- #pie chart presentation template
- #customer share analysis
- #circular graph slide design
- #market penetration visualization
About the Product
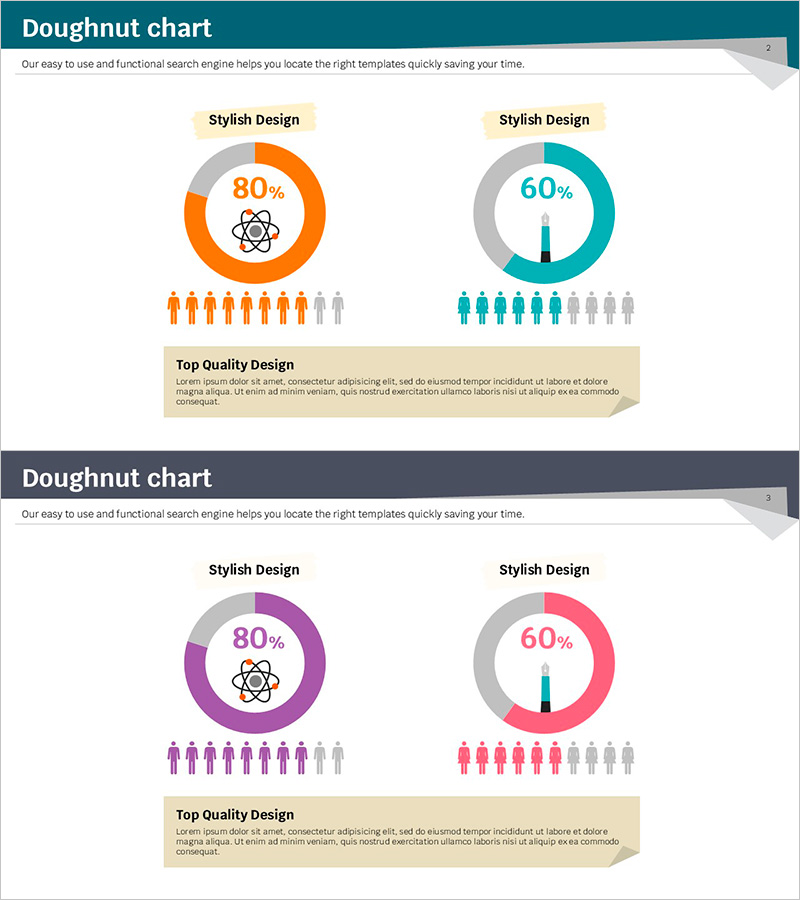
A visually effective doughnut chart PowerPoint slide for presenting customer share and market penetration data. Two slides feature dual-color donut graphs (orange and teal) with centered percentage values (80%, 60%) and human icons below to represent customer composition intuitively. Provided in 16:9 widescreen format as fully editable PPTX files. Ideal for product introductions, market analysis, and customer segmentation sections where data-driven insights strengthen your presentation narrative.
Usage Points
-
Main Usage
Clearly express ratio-based data such as customer market share, product sales composition, and revenue distribution using doughnut chart visualization. The centered percentage values immediately draw audience attention, while human icons below convey both customer scale and demographic composition simultaneously.
-
How to Use
Deploy in product introduction or market analysis sections when explaining customer distribution, sales breakdown, or market share metrics. Two slides feature distinct color schemes (orange and teal) enabling side-by-side comparison of multiple indicators. Simply edit the percentages and labels to match your actual data and customize as needed.
-
Recommended For
Recommended for marketing plans, business reports, investor pitch decks, and product overview presentations. Ideal for marketing teams, sales departments, and executive presentations emphasizing customer analysis or market positioning. Particularly effective for B2B presentations requiring data-backed decision-making narratives.
-
Slide Structure
Each slide contains one doughnut chart with centered percentage display (80%, 60%), legend labels, and ten human icons below (eight colored, two gray). Both slides maintain identical layout with color variation only, ensuring consistent visual language throughout the presentation.
Related Products
-

Internet of Things User Analysis Status – Customer Insights and Data Visualization
#Product/Service Introduction #Market and Competitor Analysis #Graph
-

Donut Chart for Comparing Research Analysis Results
#Product/Service Introduction #Technical Approach #Graph
-

Cybersecurity Service Development Status Analysis Chart
#Product/Service Introduction #Market and Competitor Analysis #Graph
-

AI System Development Status Analysis Chart - Market Share and Key Metrics
#Product/Service Introduction #Market and Competitor Analysis #Diagram
