Business Service Development Status Graph – Data Visualization and Strategic Insights
RJ0300021_7
- Last Update 04/23/2025
- File Size 5.4MB
- # of Slides 2
- File Format PPTX
- Slide Ratio 16:9
- Color
Keywords
About the Product
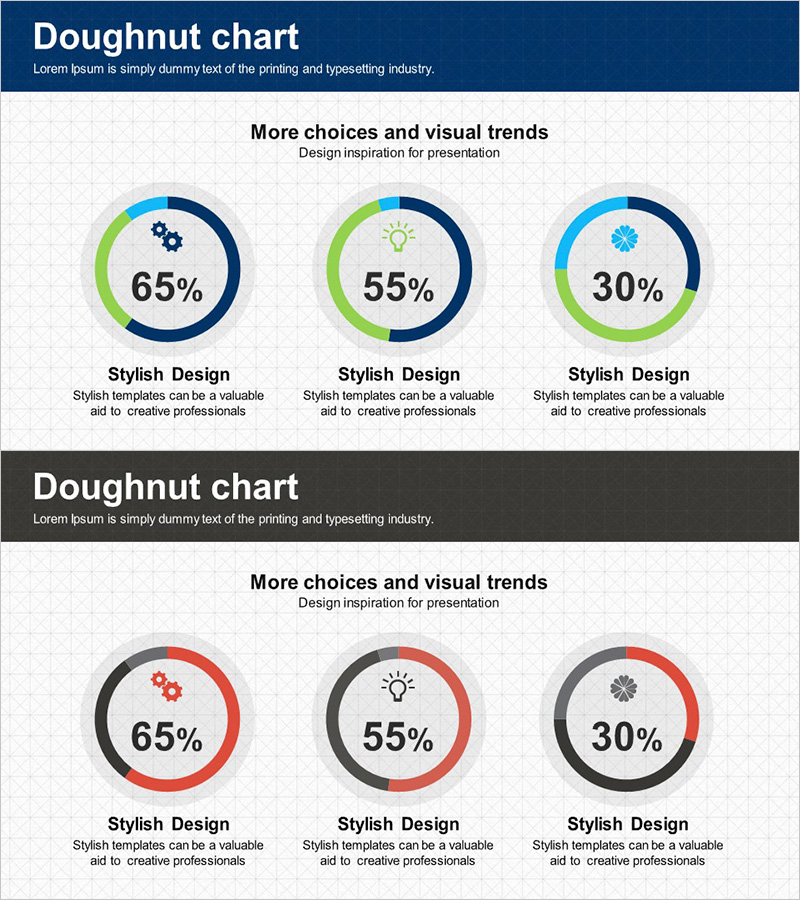
A doughnut chart PowerPoint slide that visualizes business service development status across three categories. The donut graphs use navy, lime, and sky blue color schemes with center icons (gear, lightbulb, star) to distinguish each category and display percentage values clearly. Two color variations are provided: navy-lime-sky blue and charcoal-red-gray, allowing you to match your presentation theme. This 16:9 widescreen template includes 2 slides ready for immediate editing and use.
Usage Points
-
Main Usage
Compare and analyze the proportional relationships of three data categories such as service development status, market share, customer satisfaction, or feature usage rates. The center icons provide intuitive meaning while the percentage values emphasize numerical data.
-
How to Use
Use in executive reports, business status presentations, marketing analysis documents, and strategy meeting materials to explain key performance indicators. Edit the percentage values and labels to input your actual data, and select the color combination that matches your presentation theme.
-
Recommended For
Executives, marketing managers, business analysts, consultants, and project managers use this template for quarterly reports, performance presentations, and client proposal materials that require data-driven decision support.
-
Slide Structure
2-slide template with 3 doughnut charts arranged horizontally on each slide. Each chart features a center icon (gear, lightbulb, or star), percentage value, and category label below. First slide uses navy-lime-sky blue palette; second slide uses charcoal-red-gray palette.
Related Products
-

Progress Status Order Circle Graph – Visualizing Project Progress
#Product/Service Introduction #Business Introduction #Diagram
-

Development Status Analysis Comparison Graph – Market Share & Growth
#Product/Service Introduction #Market and Competitor Analysis #Graph
-

Map Donut Graph for Visualizing Market Share – Symbol of Practicality and Change
#Product/Service Introduction #Market and Competitor Analysis #Graph
-

Market Share Donut Pie Chart – Insightful Data Visualization
#Product/Service Introduction #Diagram #Graph
