Development Status Analysis Comparison Graph – Market Share & Growth
RJ0300074_5
- Last Update 05/09/2025
- File Size 0.2MB
- # of Slides 2
- File Format PPTX
- Slide Ratio 16:9
- Color
Keywords
- #Content-Based Slides
- #Design-Based Slides
- #Product/Service Introduction
- #Market and Competitor Analysis
- #Graph
- #Development Status
- #Market Share
- #Circles
- #Doughnut Chart
- #16:9
- #donut chart PowerPoint slide
- #pie chart PPT template
- #ratio comparison graph
- #circular chart slide design
- #market share analysis PowerPoint
- #4-item data visualization slide
About the Product
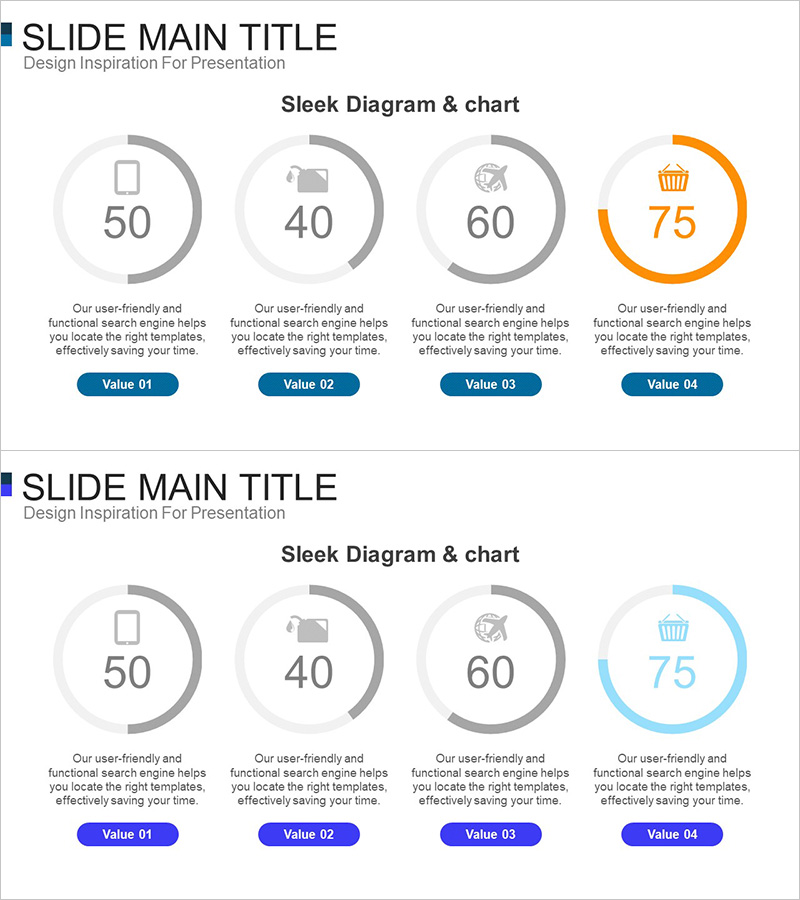
A PowerPoint slide featuring donut-shaped pie charts for comparing development status, market share, and growth trends at a glance. Four data items are visualized as circular segments with icons and descriptive text beneath each chart, enhancing information clarity. The multi-color palette—orange, gray, and blue—distinguishes emphasis items visually, while the 16:9 widescreen layout and 2-slide structure integrate seamlessly into presentations and reports. Each donut chart includes clearly marked data entry fields for easy editing, making it ideal for business analytics and comparative analysis sections.
Usage Points
-
Main Usage
Visualize the proportional relationships of four data items—such as development progress, market share, growth rate, or category distribution—using donut-shaped pie charts. The numeric values and icons beneath each chart convey data magnitude and meaning intuitively, making it essential for comparative analysis in reports, proposals, and business presentations.
-
How to Use
Slide 1 arranges four donut charts horizontally for simultaneous multi-item comparison, while Slide 2 uses color variation (orange and blue emphasis) to highlight specific items. Double-click the numeric field in each chart to replace it with actual data; the chart updates automatically. Simply copy and paste Excel data into the fields for instant visualization.
-
Recommended For
Executives, marketing teams, strategic planning departments, and sales teams use this template for quarterly performance reviews, market status reports, and competitive analysis presentations. It is especially effective when comparing four or fewer components such as development completion rates, market share percentages, customer satisfaction scores, or product category revenue distribution.
-
Slide Structure
Slide 1: Four donut charts (sample values 50, 40, 60, 75) with category icons, descriptive text, and labels arranged horizontally. Slide 2: Identical layout with the fourth donut chart highlighted in orange to emphasize key metrics. 16:9 aspect ratio, PPTX format, all chart elements fully editable.
Related Products
-

Development Status Analysis Donut Chart – Market Share Visualization
#Product/Service Introduction #Market and Competitor Analysis #Graph
-

Stock Market Share Analysis Graph – Insights and Strategies
#Product/Service Introduction #Market and Competitor Analysis #Graph
-

Graph of Analysis of Transportation Development Status
#Product/Service Introduction #Market and Competitor Analysis #Graph
-

Doughnut Chart Visualizing Current Status of 3D Printing Technology Development
#Product/Service Introduction #Market and Competitor Analysis #Graph
