Business Income Statement Table – Visualizing Financial Performance
RJ0300021_11
- Last Update 04/23/2025
- File Size 5.6MB
- # of Slides 2
- File Format PPTX
- Slide Ratio 16:9
- Color
Keywords
- #Content-Based Slides
- #Design-Based Slides
- #Market and Competitor Analysis
- #Financial Plans and Performance
- #Diagram
- #Market Analysis
- #Income Statement
- #Table
- #Standard Table
- #16:9
- #income statement PowerPoint slide
- #financial table template
- #revenue expense profit chart
- #business data visualization PowerPoint
- #how to create income statement in PowerPoint
About the Product
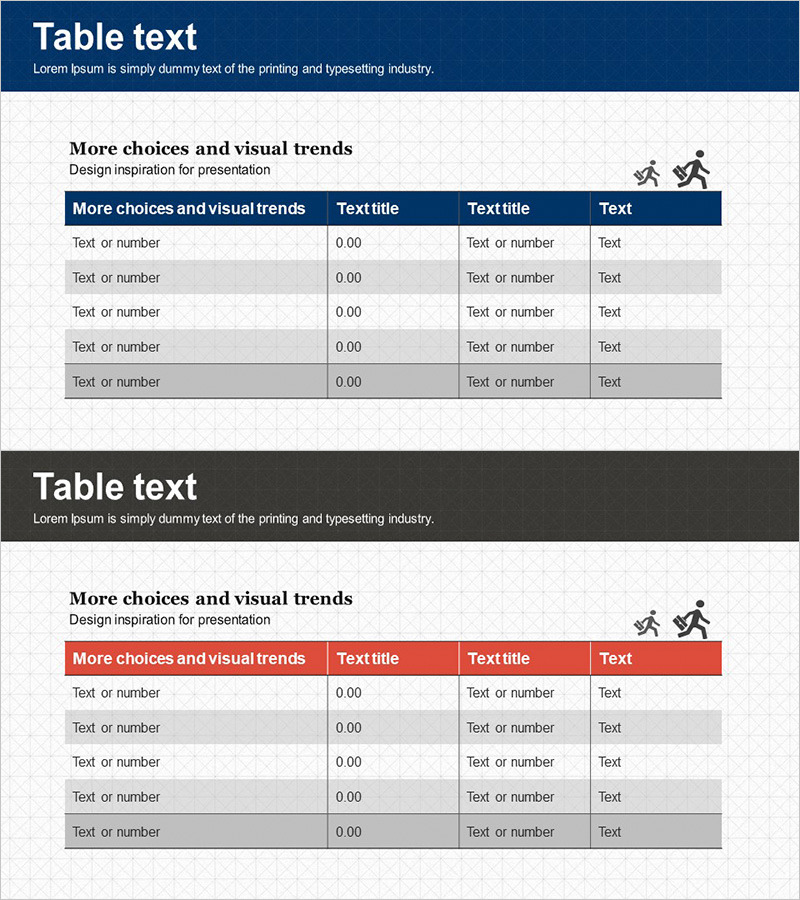
A professional income statement table PowerPoint slide designed to clearly communicate financial performance. Features a dark blue header with white and light gray row alternation for systematic data organization. The 2-slide set enables comprehensive comparison of key financial metrics including revenue, expenses, and profit margins. Ideal for investor presentations, quarterly earnings reports, and financial planning decks that require credible numerical data visualization.
Usage Points
-
Main Usage
Present financial performance and profit-loss analysis in structured table format. Organizes key financial indicators such as revenue, cost of goods sold, operating income, and net profit by row, enabling period-to-period and line-item comparisons.
-
How to Use
Use in investor relations presentations, executive financial reports, quarterly earnings calls, and business performance reviews. Input actual figures directly into cells for immediate deployment. Header colors and typography are fully editable to match corporate branding guidelines.
-
Recommended For
CFOs, financial controllers, executives, and investor relations professionals presenting financial statements. Suitable for public company earnings announcements, startup fundraising pitches, board meetings, and internal financial reviews requiring credible numerical representation.
-
Slide Structure
2-slide set with dark blue header (4 columns) and 5 data entry rows. First slide presents standard income statement layout; second slide offers alternative color scheme for flexible presentation contexts. Both maintain consistent structure for easy data input and comparison.
Related Products
-

Big Data Market Analysis Graph – Trends and Performance
#Market and Competitor Analysis #Financial Plans and Performance #Diagram
-

Trading Business Income Statement – Effective Financial Performance Presentation
#Financial Plans and Performance #Diagram #Income Statement
-

Performance Analysis Pie Chart – Market Share Visualization
#Market and Competitor Analysis #Diagram #Graph
-

Green Purple Funding Plan Table – Highlighting Financial Effectiveness
#Financial Plans and Performance #Diagram #Capital Requirements
