Income Statement Table – Clearly Presenting Financial Performance
RJ0300014_10
- Last Update 04/21/2025
- File Size 4.4MB
- # of Slides 2
- File Format PPTX
- Slide Ratio 16:9
- Color
Keywords
- #Content-Based Slides
- #Design-Based Slides
- #Financial Plans and Performance
- #Diagram
- #Income Statement
- #Key Financial Indicators
- #Table
- #Standard Table
- #16:9
- #financial table PowerPoint
- #income statement slide template
- #financial data visualization
- #table design PPT
- #how to create financial table in PowerPoint
About the Product
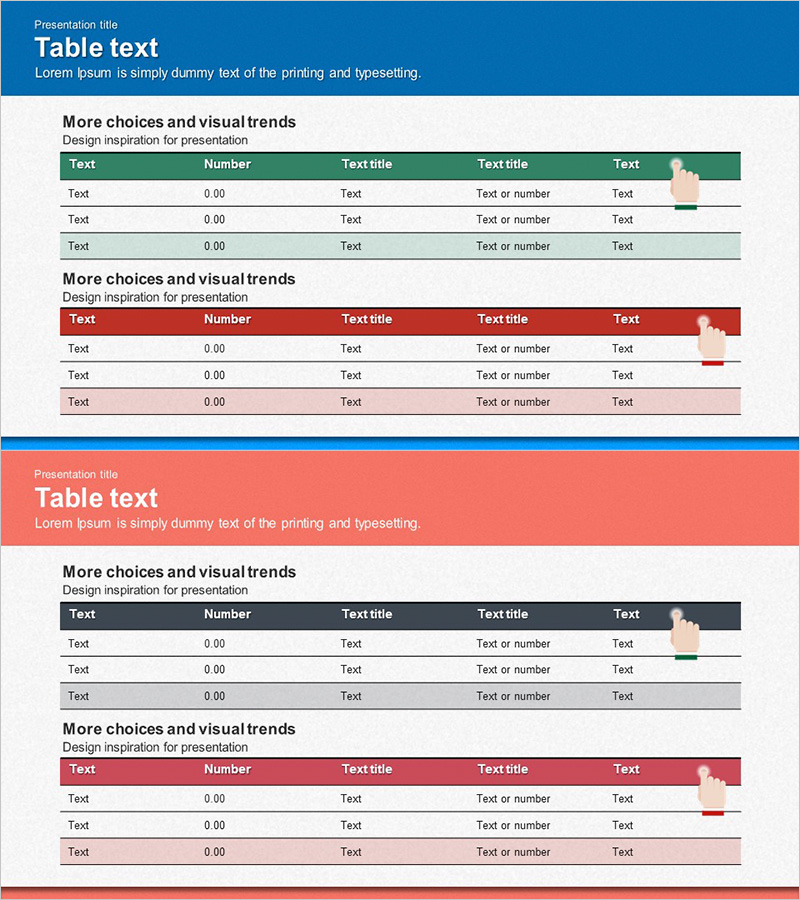
A 2-slide table set that clearly presents financial performance and data analysis. Features a 5-column income statement structure with green and red header designs, allowing you to organize text, numbers, and line items systematically. Provided in PowerPoint 16:9 PPTX format with progressive background color gradation across rows to enhance data readability. Ready to use in financial reports, business plans, quarterly performance presentations, and investor pitch decks.
Usage Points
-
Main Usage
Organize and compare financial data systematically using structured table layouts. Present income statements, financial statements, and key financial metrics in clear row-column format to improve audience comprehension.
-
How to Use
Insert into the financial performance section of reports, quarterly or annual earnings presentations, and business plan financial planning pages. Directly input text and numerical data to reflect your organization's actual financial figures.
-
Recommended For
CFOs, finance managers, and executives presenting financial performance to investors, shareholders, and employees. Ideal for startup investor pitch decks, public company quarterly earnings reports, and internal management meetings.
-
Slide Structure
2-slide set with each slide containing a 5-column header (text, number, item title, item title, text) and 3-row data area. First slide features green header; second slide features red header. Row background colors progress gradually to create visual hierarchy and improve data distinction.
Related Products
-

Leather Material Presentation Template Table Chart – Financial Performance Visualization
#Financial Plans and Performance #Diagram #Income Statement
-

Business Income Statement – Visualizing Financial Performance
#Financial Plans and Performance #Diagram #Income Statement
-

Key Financial Indicators Table – Essential Information Visualization
#Financial Plans and Performance #Diagram #Income Statement
-

Key Financial Indicators Table – Clear Profit Analysis
#Financial Plans and Performance #Diagram #Income Statement
