Visualizing Market Analysis and Performance with Reading Learning Table Charts
RJ0500041_23
- Last Update 06/18/2025
- File Size 0.2MB
- # of Slides 2
- File Format PPTX
- Slide Ratio 16:9
- Color
Keywords
- #Content-Based Slides
- #Design-Based Slides
- #Market and Competitor Analysis
- #Financial Plans and Performance
- #Diagram
- #Other
- #Market Analysis
- #Projected Return on Investment (ROI)
- #Table
- #Standard Table
- #16:9
- #data table PowerPoint slide
- #comparison chart template
- #market analysis table
- #financial performance template
- #multi-row data visualization
About the Product
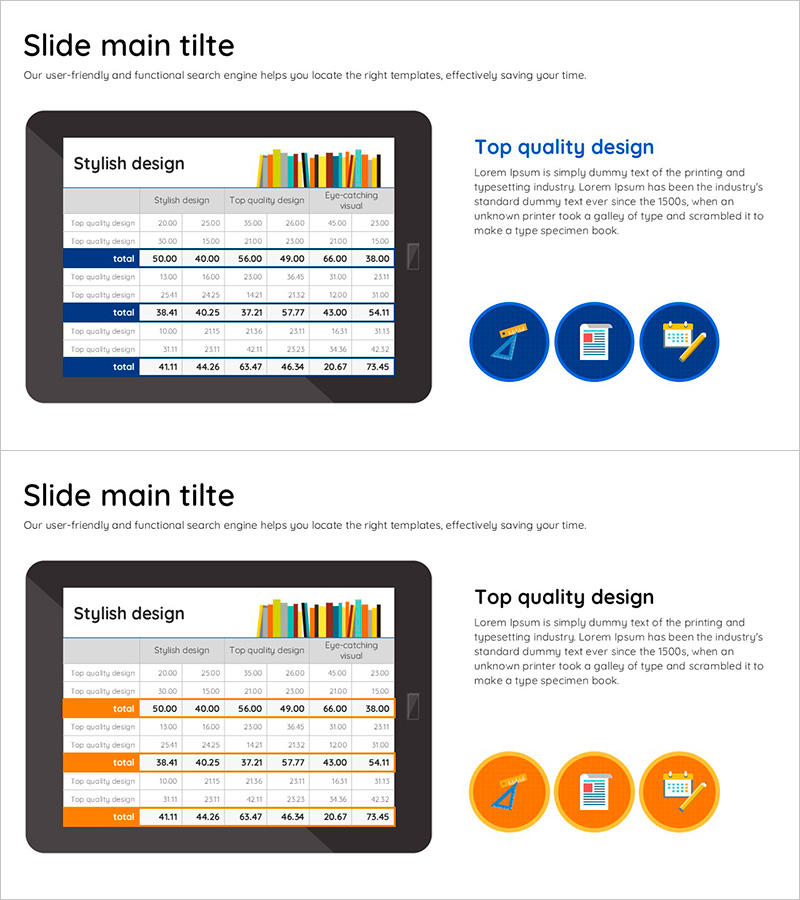
A multi-row data table PowerPoint slide designed to compare market analysis and financial performance at a glance. The 2-slide set features a 6-column × 5-row table with blue accent rows on the first slide and an orange accent row on the second slide, allowing you to organize and present numerical data by category. Each table header includes a colorful bar chart icon at the top, reinforcing the data visualization intent. This presentation slide effectively structures complex numerical information and enables comparative analysis in business reports, investor presentations, and performance reviews.
Usage Points
-
Main Usage
Organize complex numerical data in a structured table format to clearly communicate market analysis, financial performance, sales results, and other comparative information. Row-level color highlighting visually distinguishes key items and focuses audience attention on critical data points.
-
How to Use
Use in business reports, investor presentations, and marketing strategy meetings to compare quarterly, annual, or departmental performance metrics. Input actual data into table cells and adjust row colors as needed to emphasize important categories or trends.
-
Recommended For
Finance professionals, marketing managers, business analysts, and consultants who need to present quantitative data-driven insights. Ideal for quarterly performance reviews, market research presentations, financial planning sessions, and competitive analysis discussions.
-
Slide Structure
2-slide set. Slide 1: 6-column × 5-row data table with blue accent row + colorful bar chart icon at top. Slide 2: identical table structure with orange accent row + icon. Each table clearly separates header and data rows for distinct information hierarchy and easy readability.
Related Products
-

Table and Area Graph for Market Analysis
#Market and Competitor Analysis #Diagram #Graph
-

World Travel Template Table – Market Analysis Material
#Market and Competitor Analysis #Diagram #Other
-

Financial Performance and Forecast – Diagram for Business Strategy
#Business Strategy #Financial Plans and Performance #Diagram
-

Target Market Analysis Table
#Company Introduction #Market and Competitor Analysis #Diagram
