Comparative Analysis of Eco-Friendly Categories Slide – Market Competitive Advantage
RB0500018_7
- Last Update 03/14/2025
- File Size 1MB
- # of Slides 2
- File Format PPTX
- Slide Ratio 4:3
- Color
Keywords
- #Content-Based Slides
- #Design-Based Slides
- #Market and Competitor Analysis
- #Financial Plans and Performance
- #Diagram
- #Graph
- #Market Analysis
- #Competitive Advantage
- #Capital Requirements
- #Table
- #Column
- #Horizontal Table
- #Column Chart
- #4:3
- #horizontal bar chart PowerPoint
- #comparative analysis slide
- #data visualization PPT
- #market analysis presentation
- #business comparison template
About the Product
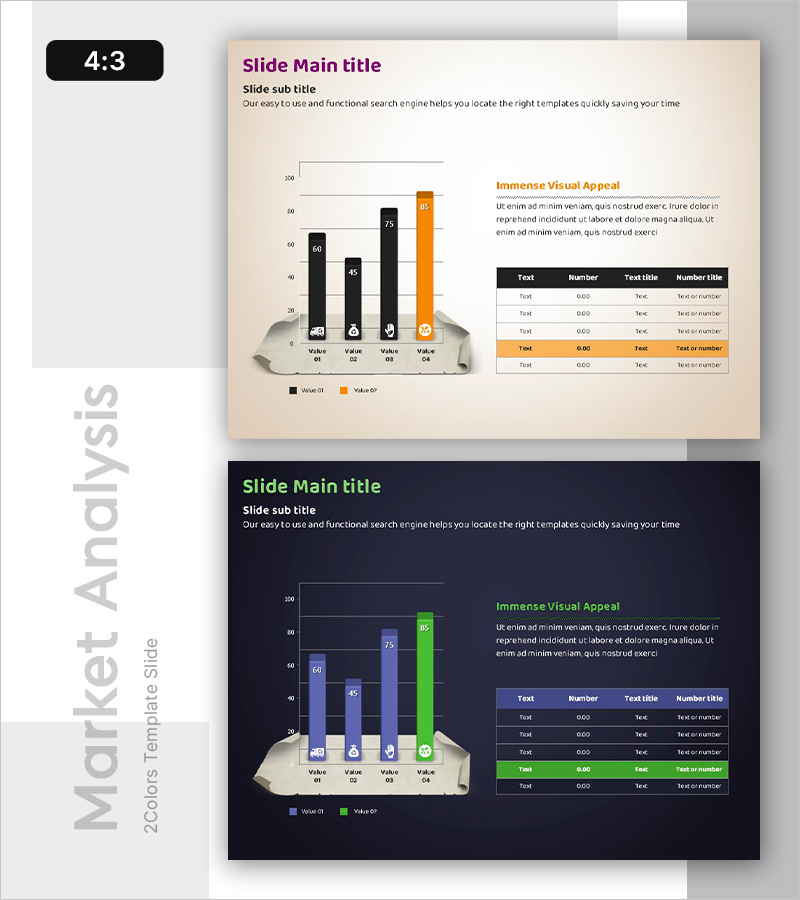
A horizontal bar chart PowerPoint slide optimized for market competitive analysis and item-by-item performance comparison. Designed with a beige background and black-orange dual-tone bars, this slide clearly visualizes numerical data across four items in two data series. Perfect for representing market share, sales volume, satisfaction ratings, and other comparative metrics. The layout combines a text box on the right for qualitative insights with a data table below for quantitative figures, enabling simultaneous delivery of narrative and numerical evidence. Provided in 4:3 aspect ratio PPTX format, fully editable and ready to customize.
Usage Points
-
Main Usage
Visualizes market competitive positioning, product performance benchmarking, sales results comparison, and customer satisfaction survey outcomes by contrasting four items across two data series. The bar-length representation enables intuitive numerical comparison, making it highly effective for business reports, proposals, and management analysis presentations.
-
How to Use
Input actual data into the left-side horizontal bar chart and write analysis findings or key insights in the right-side text box. Complete the bottom data table with precise figures so the audience can verify quantitative evidence. Colors and bar lengths are fully customizable to match your brand or emphasis.
-
Recommended For
Executives, marketing teams, sales departments, consultants, and data analysts. Ideal for business plans, marketing strategy documents, quarterly performance reports, competitive analysis materials, and client proposals where data-driven decision-making requires visual support.
-
Slide Structure
2-slide set. Slide 1: Horizontal bar chart with 4 items (Value 01–04) in black and orange dual series, right-side text box (title and description), bottom legend, and 4×4 data table. Slide 2: Identical layout with dark theme (black background, blue and green bars). Both slides include editable data table for numerical input.
Related Products
-

Column Chart for Comparative Analysis – Market and Competitive Advantage
#Market and Competitor Analysis #Graph #Market Analysis
-

Bidding Outlook Analysis Graph – Market Analysis and Forecast
#Market and Competitor Analysis #Financial Plans and Performance #Graph
-

Global Target Market Analysis Graph
#Market and Competitor Analysis #Diagram #Graph
-

Presentation Slide Visualizing Company Performance with Column Chart
#Company Introduction #Market and Competitor Analysis #Diagram
