Green Red Donut Chart – Market Share Analysis
RJ0300020_5
- Last Update 04/23/2025
- File Size 1.2MB
- # of Slides 2
- File Format PPTX
- Slide Ratio 16:9
- Color
Keywords
- #Content-Based Slides
- #Design-Based Slides
- #Market and Competitor Analysis
- #Graph
- #Market Share
- #Competitive Advantage
- #Circles
- #Doughnut Chart
- #16:9
- #donut chart PowerPoint
- #donut chart slide template
- #pie chart ratio visualization
- #market share analysis PPT
- #competitive analysis chart
- #data comparison slide template
About the Product
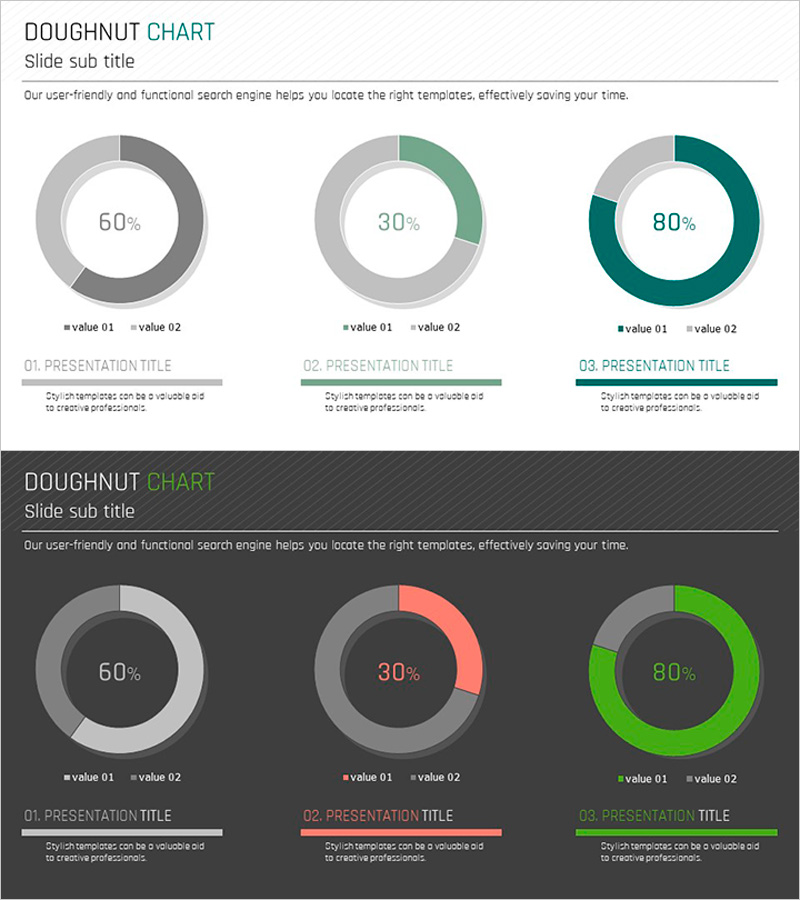
A professional donut chart PowerPoint slide template designed for market share analysis, competitive comparison, and sales composition visualization. The 2-slide set includes light and dark background versions, each featuring 3 donut charts arranged horizontally. The charts use green, red, and gray color schemes to represent data ratios intuitively, with each chart supporting 2 data series (value 01 and value 02). The center of each donut displays key percentages for immediate data comprehension. Ideal for business presentations, quarterly reports, marketing strategy decks, and investor pitch materials requiring data-driven comparison analysis.
Usage Points
-
Main Usage
Visualizes 2-series ratio data such as market share, competitor positioning, sales composition, and customer distribution in circular donut format. The white center area displays key percentages, enabling instant data comprehension and highlighting the relationship between parts and whole.
-
How to Use
Apply to business report market analysis sections, marketing strategy competitive advantage discussions, investor pitch deck revenue composition explanations, and quarterly performance report achievement rate displays. Use the light background version for bright presentation venues and the dark background version for projection in low-light environments.
-
Recommended For
Finance and planning teams presenting executive reports, marketing teams conducting market analysis, sales teams explaining customer composition, consulting firms delivering industry analysis, and startups preparing investor pitch decks. Suitable for all business presentations requiring data-driven decision-making and numerical comparison.
-
Slide Structure
Light background slide: 3 donut charts arranged horizontally (left gray, center green, right teal) with titles and legends (value 01, value 02) below each chart. Dark background slide: identical layout with gray, red, and lime green color application. All charts support 2-series data input with automatic center percentage calculation.
Related Products
-

Market Share and Competitive Advantage via Bar and Donut Charts – Product Satisfaction Survey
#Market and Competitor Analysis #Graph #Market Share
-

Animals Nature Donut Chart Infographics – Market Share Analysis
#Market and Competitor Analysis #Graph #Market Share
-

Running Silhouette Donut Chart
#Market and Competitor Analysis #Graph #Market Share
-

Graph of Environmental Pollution – Market Share Analysis
#Market and Competitor Analysis #Graph #Market Share
