Travel Agency Market Share and Trends – Data Slide for Competitive Advantage
RJ0600035_8
- Last Update 06/30/2025
- File Size 0.6MB
- # of Slides 2
- File Format PPTX
- Slide Ratio 16:9
- Color
Keywords
- #Content-Based Slides
- #Design-Based Slides
- #Market and Competitor Analysis
- #Diagram
- #Graph
- #Market Share
- #Competitive Advantage
- #Table
- #Circles
- #Doughnut Chart
- #16:9
- #donut chart PowerPoint
- #pie chart slide template
- #market share data visualization
- #ratio comparison presentation
- #competitive analysis slide
About the Product
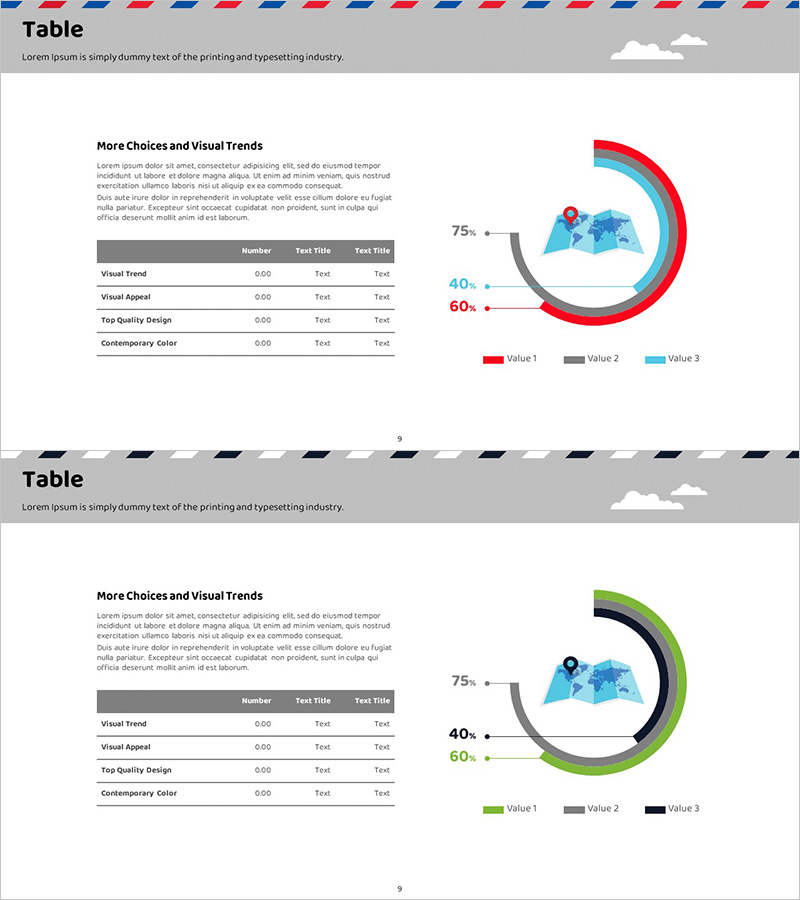
A donut chart PowerPoint slide set analyzing travel agency market share and trends across three data series. This 2-slide presentation features red, gray, and sky blue color schemes on the first slide, displaying 75%, 40%, and 60% proportions in a donut-shaped pie graph to visualize competitive advantage against market competitors. The second slide provides an alternative color version in green, gray, and black. Both slides include a world map icon and data point markers for global market analysis presentations, ready to use immediately. Delivered in 16:9 widescreen PPTX format, fully editable in all PowerPoint versions.
Usage Points
-
Main Usage
Visualize market share, competitor comparison, and proportional composition using a donut-shaped pie graph for instant data comprehension. Ideal for travel agency, tourism, retail, and financial industry market analysis presentations where competitive advantage needs emphasis, enabling simultaneous comparison of three data series.
-
How to Use
Slide 1 features red, gray, and sky blue donut chart; Slide 2 provides green, gray, and black version. Replace the percentages (75%, 40%, 60%) and legend with your actual data, then input market analysis content in the text areas. Use the world map icon to represent global market scope.
-
Recommended For
Travel agency and airline marketing managers, market research analysts, executive report writers, investment pitch presenters, and consulting strategy teams presenting competitive analysis, market trends, and market share comparisons.
-
Slide Structure
2-slide set. Slide 1: Red, gray, sky blue 3-color donut chart with 3 data points (75%, 40%, 60%), world map icon, 4 text areas (Visual Trend, Visual Appeal, Top Quality Design, Contemporary Color). Slide 2: Identical structure in green, gray, black colors. 16:9 widescreen PPTX format.
Related Products
-

Sensuous Doughnut Chart Slide – Market Share Analysis
#Market and Competitor Analysis #Diagram #Graph
-

Key Competitive Factors in Market Analysis – First Step Toward Competitive Advantage
#Market and Competitor Analysis #Diagram #Graph
-

Watercolor Customer Analysis Donut Chart – Visualizing Market Share
#Market and Competitor Analysis #Graph #Market Share
-

Analyzing Market Share with 3 Donut Charts and Tables
#Market and Competitor Analysis #Diagram #Graph
