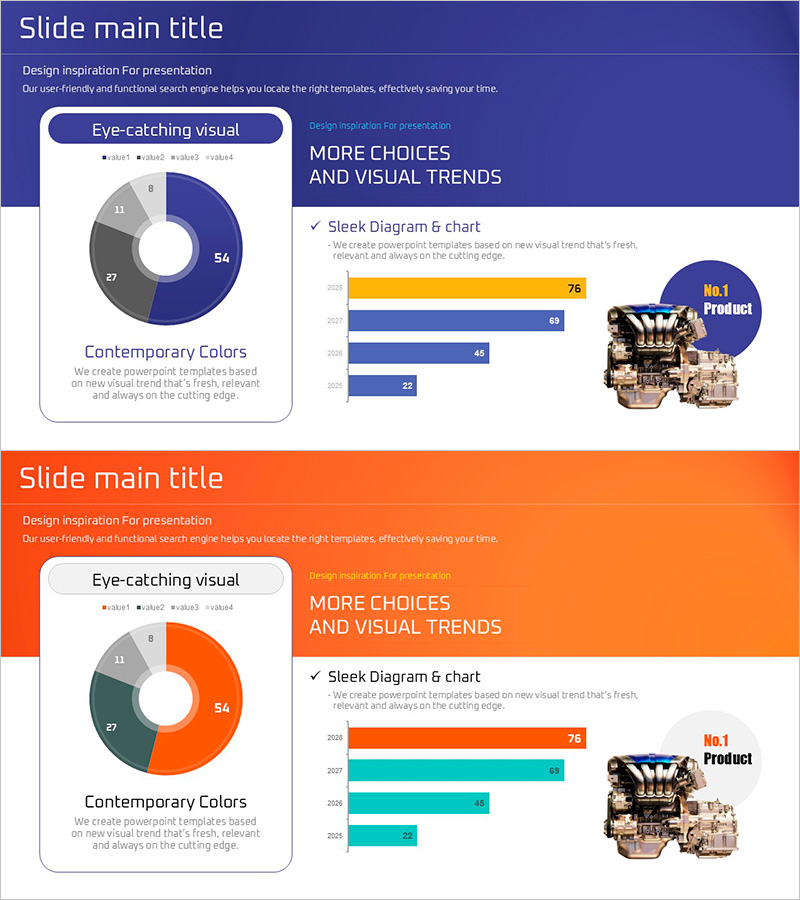
Market Share and Competitive Advantage via Bar and Donut Charts – Product Satisfaction Survey
RJ0800027_14
- Last Update 08/07/2025
- File Size 1.4MB
- # of Slides 2
- File Format PPTX
- Slide Ratio 16:9
- Color
Keywords
- #Content-Based Slides
- #Design-Based Slides
- #Market and Competitor Analysis
- #Graph
- #Market Share
- #Competitive Advantage
- #Horizontal Bar
- #Circles
- #Horizontal Bar Chart
- #Doughnut Chart
- #16:9
- #donut chart PowerPoint slide
- #pie chart presentation template
- #horizontal bar graph PPT
- #market share visualization
- #product satisfaction survey slides
- #data comparison presentation
About the Product
A 2-slide PowerPoint presentation for product satisfaction surveys and market share analysis. The donut chart visualizes the proportion of 4 segments, while the horizontal bar graph compares numerical data across categories. Navy, orange, and teal color schemes clearly differentiate data series, with product imagery and text placement enhancing presentation impact. Available in 16:9 widescreen PPTX format for immediate editing. Ideal for executive reports, marketing strategy presentations, and competitive analysis materials.
Usage Points
-
Main Usage
Simultaneously visualize product satisfaction survey results and market share data to demonstrate competitive advantage. The donut chart intuitively represents market proportion, while the horizontal bar graph clearly compares numerical changes across years or categories.
-
How to Use
Use in executive reports, quarterly performance presentations, and investor briefings to explain market position and customer satisfaction together. Simply replace donut chart values and bar graph labels with your own data for immediate deployment.
-
Recommended For
Marketing managers, product planning teams, executives, and sales leaders presenting market analysis results. Particularly effective when emphasizing competitive advantages or reporting customer satisfaction improvement trends.
-
Slide Structure
Slide 1: Donut chart (4 segments in navy, gray, orange, teal) showing market share + product image + text box. Slide 2: Horizontal bar graph (4 years, orange-navy-teal series) displaying satisfaction trends + title, legend, and data labels.
Related Products
-

Chemistry Experiment Progress Graph – Visualizing Market Share
#Product/Service Introduction #Market and Competitor Analysis #Graph
-

Circle Donut Market Share Graph – Visual Elements for Market Analysis
#Market and Competitor Analysis #Graph #Market Share
-

Travel Agency Market Share and Trends – Data Slide for Competitive Advantage
#Market and Competitor Analysis #Diagram #Graph
-

Money Donut Chart for Market Share Analysis – Emphasizing Competitive Advantage
#Market and Competitor Analysis #Diagram #Graph
