2 Versions of the Green Area Chart – Market Analysis and Competitive Edge
RJ0300020_16
- Last Update 04/23/2025
- File Size 1.3MB
- # of Slides 2
- File Format PPTX
- Slide Ratio 16:9
- Color
Keywords
- #Content-Based Slides
- #Design-Based Slides
- #Market and Competitor Analysis
- #Graph
- #Other
- #Market Status
- #Competitive Advantage
- #16:9
- #area chart PowerPoint slide
- #area chart template design
- #market analysis chart slide
- #competitive advantage data visualization
- #how to create area chart in PowerPoint
About the Product
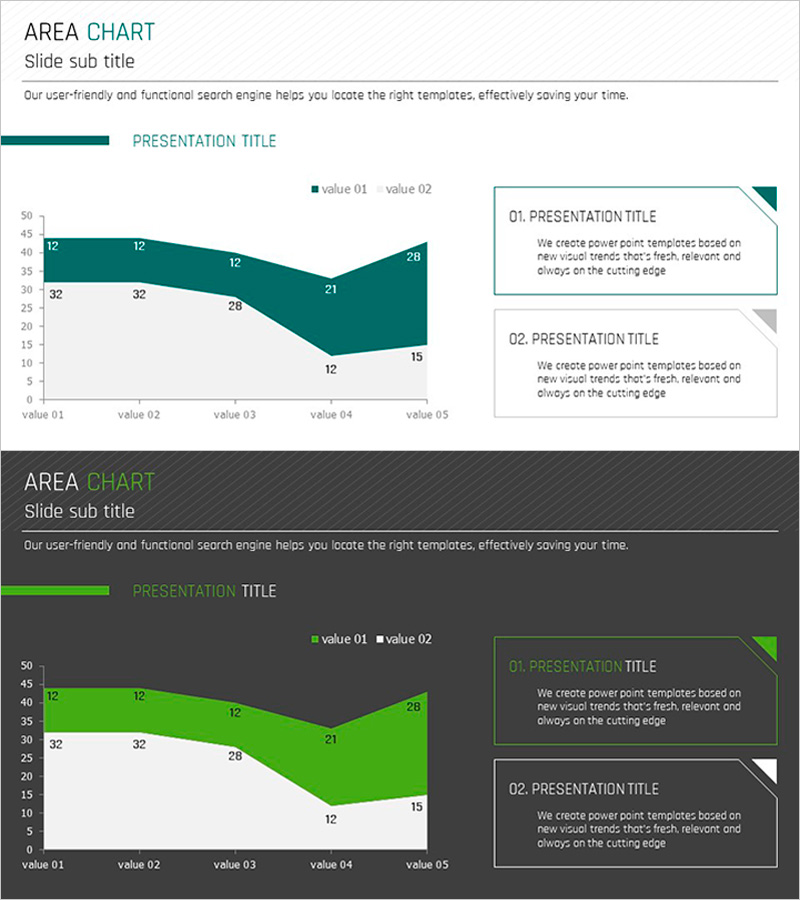
Two-version area chart PowerPoint slide designed for market analysis and competitive positioning. Features a dark green background version and a light gray background version, each visualizing data trends across five value points. The right side includes two text boxes for chart interpretation and strategic insights. The filled area design intuitively conveys data changes over time, with clear numerical labels for immediate use in presentations and reports. Ideal for comparing market share and competitive advantage across multiple periods.
Usage Points
-
Main Usage
Visualize market share evolution and competitive positioning over time using stacked area representation. The filled area format simultaneously displays total market size and individual data proportions, making it ideal for competitive advantage analysis sections where key insights need emphasis.
-
How to Use
Replace chart data with your own figures and add analysis results and strategic implications in the right text boxes. Use the dark version for premium-tone presentations and the light version for bright-tone reports to maintain visual consistency throughout your document.
-
Recommended For
Suitable for business plans, investor pitch decks, marketing strategy documents, and market analysis reports. Effectively communicates market share changes and competitive strength to executives, investors, and business partners through data-driven visualization.
-
Slide Structure
Each slide combines a left-side area chart (five data points, two-series comparison) with two right-side text boxes (title and description). Numerical labels appear above the chart for precise data reading, and a color legend clearly distinguishes each data series.
Related Products
-

Study Area Chart - Market Status and Competitive Advantage
#Market and Competitor Analysis #Graph #Other
-

Natural Landscape Illustration Graph – Market Status and Competitive Advantage
#Market and Competitor Analysis #Graph #Other
-

The Importance of Modern People's Health Care – Insights from Market Analysis
#Market and Competitor Analysis #Graph #Other
-

Area Chart for Science Topics – Gain Competitive Advantage through Data Analysis
#Market and Competitor Analysis #Graph #Other
